TL;DR Breakdown
- Monero price analysis shows that further boost maybe expected above $260.47.
- Today, market has experienced a tremendous rise in the price value.
- Support level goes up to $250.85, as per the latest analysis.
The up-to-date Monero price analysis is showing a heightening momentum from the bullish side. The price levels have covered an exceedingly wide range, as the bullish momentum has proved to be quite a blow for the bears. The price levels have returned to $255.5, their former high, causing the bearish control to collapse. The support levels are also rising above $250.85 and may reach a new height soon if the bullish momentum strengthens even further.
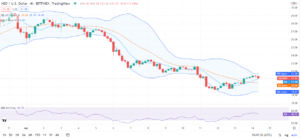
XMR/USD 1-day price chart: Bullish momentum stimulates after constant rejection
The 1-day Monero price analysis is displaying encouraging signs for the buyers, and motivating them to further add to the asset value. Despite the previous week experiencing a crossover of SMA 20 over SMA 50, the latest trends have proved negative for cryptocurrency.
In the past two days, bearish superiority was observed, yet today, a commendable rise in price has happened above $260 resistance. This value is extremely near to the moving average (MA) which is the mean price value i.e. $266.04. Yet, the volatility is decreasing and the Bollinger bands average has also reduced to $256.5 which is a negative indication for the future as per Monero price analysis.

The Relative Strength Index (RSI) score has also jumped after a slight downfall and has successfully attained the value of 55.54. If we talk about the Bollinger bands values, then the upper band is present at $285.43 whereas the lower band is present at $227.54, at the time of writing.
Monero price analysis: 4-hours chart manifests signs of groundbreaking recovery
The 4-hours XMR/USD chart is showing that the cryptocurrency has encountered continuous bearish strikes, and has succeeded in breaking through $260. The SMA 20 curve has also reached a new height and the Bollinger bands average has increased up to $267.69. The gap between Bollinger bands is widening, which is an indicator of increasing volatility and the future probability of bullish momentum taking over.

The RSI score is also increasing and has is currently at 44.98 of value, whereas the moving average has reached $261.47. The Bollinger bands are expanding, with the upper band going to $284.53 and the lower band stooping to $250.85.

The overall trends for the market have been in favor of the buyers, as the summary is indicating. There are a total of 26 indicators, among which eleven are present at the buying position, ten at the neutral position, and the remaining five are at the selling position. The moving averages are also giving bullish signals, with ten indicators are in the buying state, four in the selling where one is in the neutral state.
The past week has proved very crucial for both the bulls and the bears, as both have showcased their strengths. This is why the oscillators are showing neutral signals, with a total of nine oscillators at neutral state, one being at the buying state and the remaining one at the selling state.
Monero price analysis conclusion
From the Monero price analysis, it is evident that the bulls are taking a lead again. The momentum has been huge and has swept past the bears with a surprising rise in price, taking the value to $260.47.
Despite the disappointing results in the past hours, currently, the price levels are jumping at a magnificent level, as the support has also increased to $250.85. If the support level is maintained, then cryptocurrency may reach a new high above the resistance i.e. $280.
Disclaimer. The information provided is not trading advice. Cryptopolitan.com holds no liability for any investments made based on the information provided on this page. We strongly recommend independent research and/or consultation with a qualified professional before making any investment decisions.
Source: https://api.follow.it/track-rss-story-click/v3/tHfgumto13BT868RS5sEjW0dX84dnP8Y
- 98
- advice
- among
- analysis
- asset
- bearish
- Bears
- Bullish
- Bulls
- Buying
- cryptocurrency
- curve
- data
- eleven
- expanding
- future
- gap
- Giving
- High
- HTTPS
- huge
- index
- information
- investment
- Investments
- IT
- latest
- lead
- Level
- liability
- Making
- Market
- Momentum
- Monero
- Near
- present
- price
- Price Analysis
- range
- research
- Results
- Signs
- State
- Strikes
- support
- support level
- Technical
- time
- Trading
- Trends
- value
- Volatility
- week
- writing