Polkadot price analysis has shown bearish signs again today, as price dropped to as low as $14.65. After forming an uptrend yesterday up to $15.60, it was expected that DOT would be able to conjure momentum to move up to $16.10. However, bears took control once again near the demand zone at $15.52. At current trend, price is hovering near support at $15.00 and could fall further towards $14.50 if the downtrend continues over the next 24 hours. DOT trading volume over the day’s trade fell about 12 percent, while it lost 2 percent in market capitalisation.
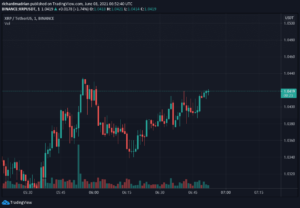
The larger cryptocurrency market mainly consolidated at current prices, headed by Bitcoin’s show of promise above $38,500. Ethereum moved back closer to $3,000 with a 2 percent increment, while major Altcoins showed mixed results. Ripple rose up to $0.61 with a 2 percent increment, while Cardano moved down to $0.78 and Dogecoin lost 2 percent to move down to $0.13. Solana also declined more than 2 percent to move as low as $88.09, while Terra rose up to $84.77 with a 3 percent uptrend.

Polkadot price analysis: DOT RSI in severe oversold zone on daily chart
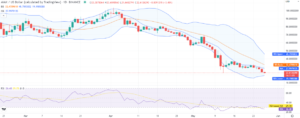
On the 24-hour candlestick chart for Polkadot price analysis, price can be seen facing a retestment towards the support zone at $15.02. After recording an uptrend yesterday to move up to $15.50, traders quickly looked to gain short-term profits as sell-offs initiated. This pushed price down again today, recording a low of $14.65. The crucial 50-day exponential moving average (EMA) sits well above at $16.33, which would be the expected upper target if DOT can consolidate momentum.

The 24-hour Relative Strength Index (RSI) fell into the oversold zone after moving down to 33.71. The current market valuation for DOT is further weakened by the loss in trading volume up to 12 percent. Meanwhile, the Moving Average Convergence Divergence (MACD) curve continues to form higher lows below the neutral zone and provides further bearish outlook for DOT. If a trend reversal occurs, DOT will look to move as high as $15.60 where the next demand zone is set. A further increment would see the $16 resistance tested to reach April 26 high of $16.71.
Disclaimer. The information provided is not trading advice. Cryptopolitan.com holds no liability for any investments made based on the information provided on this page. We strongly recommend independent research and/or consultation with a qualified professional before making any investment decisions.
- $3
- 000
- 10
- 2022
- 77
- About
- advice
- Altcoins
- analysis
- April
- average
- bearish
- Bears
- closer
- continues
- control
- could
- crucial
- cryptocurrency
- cryptocurrency market
- Current
- curve
- Demand
- down
- dropped
- EMA
- expected
- faces
- facing
- form
- further
- High
- higher
- holds
- HTTPS
- index
- information
- investment
- Investments
- IT
- larger
- liability
- looked
- made
- major
- Making
- map
- Market
- mixed
- Momentum
- more
- move
- moving
- Near
- Outlook
- percent
- Polkadot
- price
- Price Analysis
- professional
- profits
- provides
- qualified
- quickly
- reach
- recommend
- research
- Results
- roadblocks
- set
- short-term
- Signs
- Solana
- strength
- support
- Target
- Terra
- today
- towards
- trade
- Traders
- Trading
- Valuation
- volume
- while
- would