TL;DR Breakdown
- Polkadot price analysis records 5 percent increase over the past 24 hours
- DOT shows breakaway for the first time since February 28
- Trading volume grew 3 percent with market capitalisation rising by 6 percent
Polkadot price analysis is finally bullish for the first time this month, as price jumped up more than 5 percent over the past 24 hours. Price jumped as high as $18.05 as trading volume also pushed up by 3 percent, along with DOT market capitalisation growing by 6 percent. Price has risen for the first time since February 28, but stays well below the then high of $18.90. DOT price fought off multiple rejections from the 50-day simple moving average (SMA) to extend beyond the demand zone lying between $11.37 and $15.66 and further consolidation from current price of $17.89 could trigger a 20 percent uptrend towards $22.23.
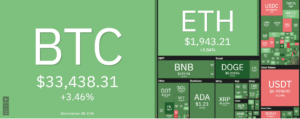
The larger cryptocurrency market made significant upturns throughout the board, led by Bitcoin’s 9 percent rise to take price past $42,000. Ethereum also grew 6 percent, with price sitting at $2,700. Among Altcoins, Ripple reached up to $0.77 with a 6 percent increment, while Cardano also rose 6 percent to move up to $0.85. Dogecoin rose 5 percent, Solana 6 percent, while Terra made the biggest increment in the market, rising 22 percent to reach as high as $103.36.

Polkadot price analysis: Price heads upwards to form local top at $17.23
On the 24-hour candlestick chart for Polkadot price analysis, price can be seen forming a run for the $22.23 key resistance point after spending the last week around the $15.66 demand zone. The current uptrend is set to form a local top at $17.23 where some selling pressure may be expected from short-term market entrants, but a bullish extension past $20 remains a possibility. Technical indicators show favourable signs for it, with price sitting above the crucial 50-day exponential moving average (EMA) after facing previous rejections of it.

The market valuation also seems favourable for DOT, with the relative strength index (RSI) value seen at 46.50 indicating a ripe market interest for the token. Furthermore, the moving average convergence divergence (MACD) formed a bullish crossover overnight and sits above the neutral zone to provide a bullish outlook for Polkadot. That being said, a lower knock off cannot be ruled out. If price falls below the crucial 50-day EMA, price may implode towards the previous trend and settle within the $11.66-$15.41 demand zone. A further falling past $10.37 would completely eradicate the bullish sentiment.
Disclaimer. The information provided is not trading advice. Cryptopolitan.com holds no liability for any investments made based on the information provided on this page. We strongly recommend independent research and/or consultation with a qualified professional before making any investment decisions.
- 000
- 28
- 77
- 9
- advice
- Altcoins
- among
- analysis
- around
- average
- being
- Biggest
- board
- Bullish
- consolidation
- could
- crucial
- cryptocurrency
- cryptocurrency market
- Current
- Demand
- EMA
- expected
- extend
- facing
- Finally
- First
- first time
- form
- Growing
- High
- holds
- HTTPS
- Increase
- index
- information
- interest
- investment
- Investments
- IT
- jump
- Key
- larger
- Led
- liability
- local
- Making
- map
- Market
- move
- moving
- Outlook
- Polkadot
- possibility
- pressure
- price
- Price Analysis
- professional
- provide
- qualified
- recommend
- records
- research
- Run
- Said
- sentiment
- set
- significant
- Signs
- Simple
- Solana
- Spending
- Technical
- Terra
- throughout
- time
- token
- top
- Trading
- Valuation
- value
- volume
- week
- within