TL;DR Breakdown
- The Polkadot price analysis is strongly bearish.
- Resistance for DOT is present at the $19.7 level.
- Support for DOT is present at $17.7.
The Polkadot price analysis shows a sudden decrease in price as the price levels fell drastically today. The bearish trend has been following since 4th April as the price trend line is going downwards; the bears are desperately trying to take the price even lower than its current value, which is $18.06.
The bearish trend has been undefeated today as the strong correction that started during the ending hours of the previous trading session is continuing up till now, and the price levels have sunk below the lower limit of the volatility indicator, which is an alarming situation for the cryptocurrency. The next support is still below for DOT at $17.7, which is nearby, but the price has already stepped into the lower price envelope.
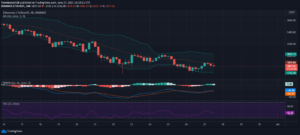
DOT/USD 1-day price chart: DOT is yet to find support
The 1-day chart for Polkadot price analysis shows cryptocurrency price movement is strongly in a bearish direction today. The bearish momentum has constantly been building over the past week as the coin, after losing significant value, is reporting a loss of 19.88 percent over the course of the last seven days as the price is trading at $18 at press time after losing around eight percent value during the last 24 hours. As more sellers are entering the market, the trading volume has increased by 61 percent today, mostly contributing negatively to the DOT’s value.

The Bollinger bands are also very important in determining the ongoing market trends, and the indicator is showing increasing volatility for the crypto pair as the upper Bollinger band has moved up to $23.9 while the lower band has travelled down to $18.4, respectively. As the trend is overwhelmingly bearish, the price has sunk below the lower band, which is a worrisome situation for the buyers.
The moving average (MA) is trading at $20.5 after crossing down the SMA 50 curve, which is another bearish indication. As in the previous week, DOT has been losing significant value due to the selling pressure. The Relative Strength Index (RSI) score is going down and is 38 for today.
Polkadot price analysis: Recent developments and further technical indications
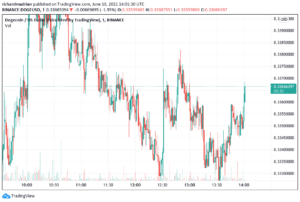
The 4-hours price chart shows that the correction has been going on for the last 16 hours, which only strengthened more during the last four hours. The bearish momentum has been stronger, as the price has immediately dropped to $18.

The coin price value is way below the Bollinger bands lower value, and the SMA 20 is also trading below the SMA 50 curve on the 4-hour chart as well. The Bollinger bands are also expanding on the hourly chart, hinting at increasing volatility, with their mean average line forming at $19.5. The RSI has stepped into the underbought zone as it is trading at index 26, indicating high bearish pressure in the market.
Polkadot price analysis conclusion
From the above Polkadot price analysis, it can be critically observed that the bears are in the dominant position and are exercising their practice mercilessly. More sellers are flushing the market, and a further decrease in DOT value can also be expected in the coming hours if the support at $17.7 also crashes down.
Disclaimer. The information provided is not trading advice. Cryptopolitan.com holds no liability for any investments made based on the information provided on this page. We strongly recommend independent research and/or consultation with a qualified professional before making any investment decisions.
- 7
- 9
- advice
- already
- analysis
- Another
- April
- around
- average
- bearish
- Bearish Momentum
- Bears
- Building
- buyers
- Coin
- coming
- crypto
- cryptocurrency
- Current
- curve
- determining
- developments
- down
- dropped
- expanding
- expected
- following
- further
- going
- High
- holds
- HTTPS
- important
- increased
- increasing
- index
- information
- investment
- Investments
- IT
- Level
- liability
- Line
- made
- Making
- Market
- Market Trends
- Momentum
- more
- movement
- moving
- Polkadot
- practice
- present
- press
- pressure
- price
- Price Analysis
- professional
- qualified
- recommend
- research
- Sellers
- significant
- started
- strong
- support
- Technical
- time
- today
- Trading
- Trends
- value
- Volatility
- volume
- week
- while