Published 13 hours ago
Amid the increasing uncertainty in the crypto market, a majority of major cryptocurrencies show signs of price correction. These minor retracements could assist buyers to recuperate bullish momentum and offer a discount price to interested traders. Here are some of the Top altcoins that can prolong a bullish recovery in April 2023.
Solana(SOL)

Source- Tradingview
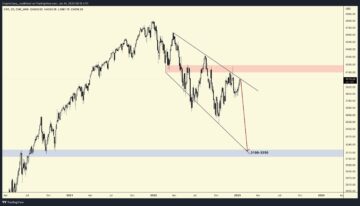
Since May 2022, the Solana price witnessed a steady downtrend under the influence of a downsloping trendline. The coin showed several failed attempts to breach this trendline indicating sellers nullifying the buyers’ attempt at this dynamic resistance.
Trending Stories
By the press time, the Solana coin price traded at the $19.89 mark with an intraday loss of 5.06. Though the aforementioned trendline is currently leading an aggressive downtrend, a possible breakout from this level will be a key signal for trend reversal.
Depending on market sentiment, the post-breakout rally could push the Solana price to potential targets of $26, $38, or $48 mark.
XRP(XRP)
Source- Tradingview
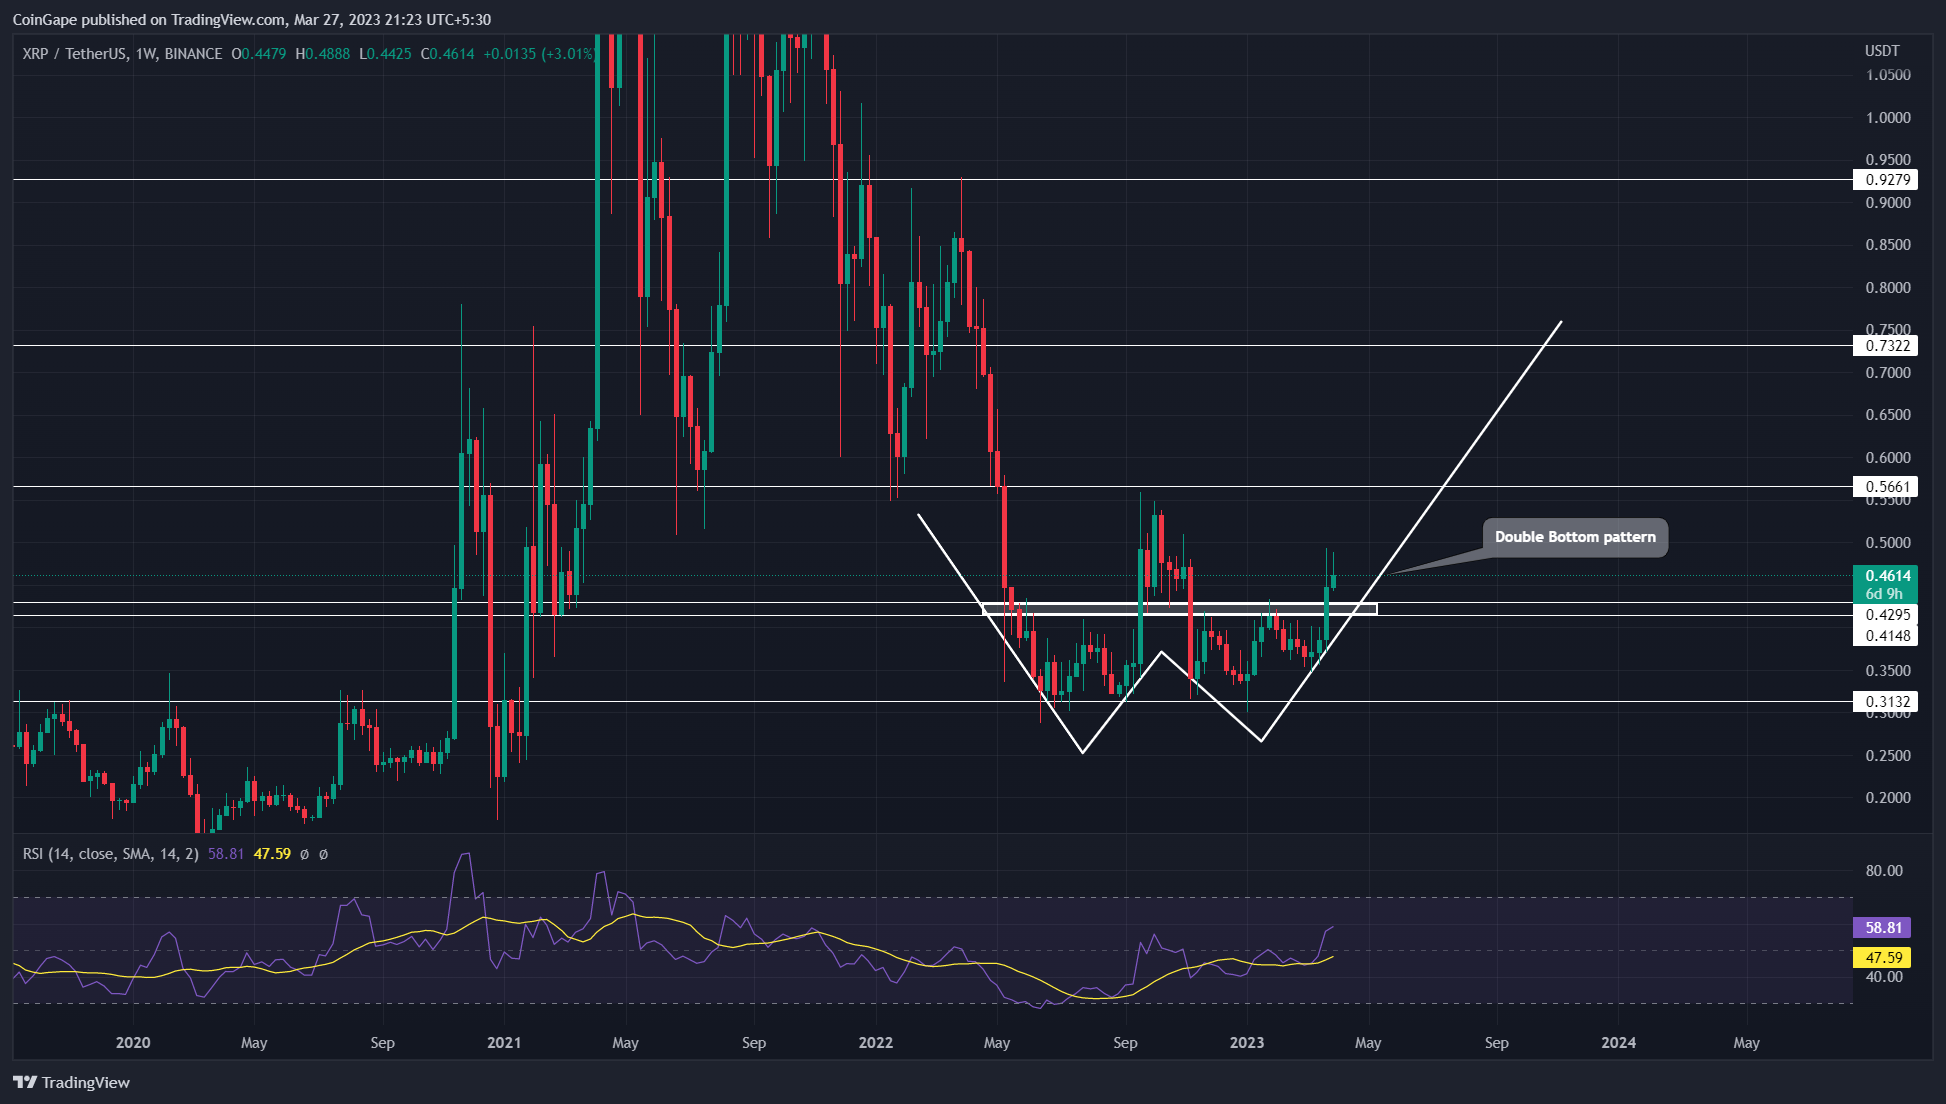
Using the $0.31-$0.3 as base support, the XRP price shows a double bottom pattern in the weekly time frame chart. This is a famous bullish reversal pattern, where the price rebounding twice from the same horizontal support indicates active accumulation from traders.
Amid the recent recovery in the crypto market, the XRP price has recently reached a local resistance of $0.43-$0.415. This bullish breakout could encourage buyers to prolong the price rally by 20% up and challenge the pattern’s neckline resistance of $0.55.
Under the influence of the double bottom pattern, the XRP price is likely to breach the $0.55 barrier which will be an early sign of trend reversal.
Also Read: Top 6 Liquid Staking Platforms On Ethereum
Chainlink(LINK)
Source- Tradingview
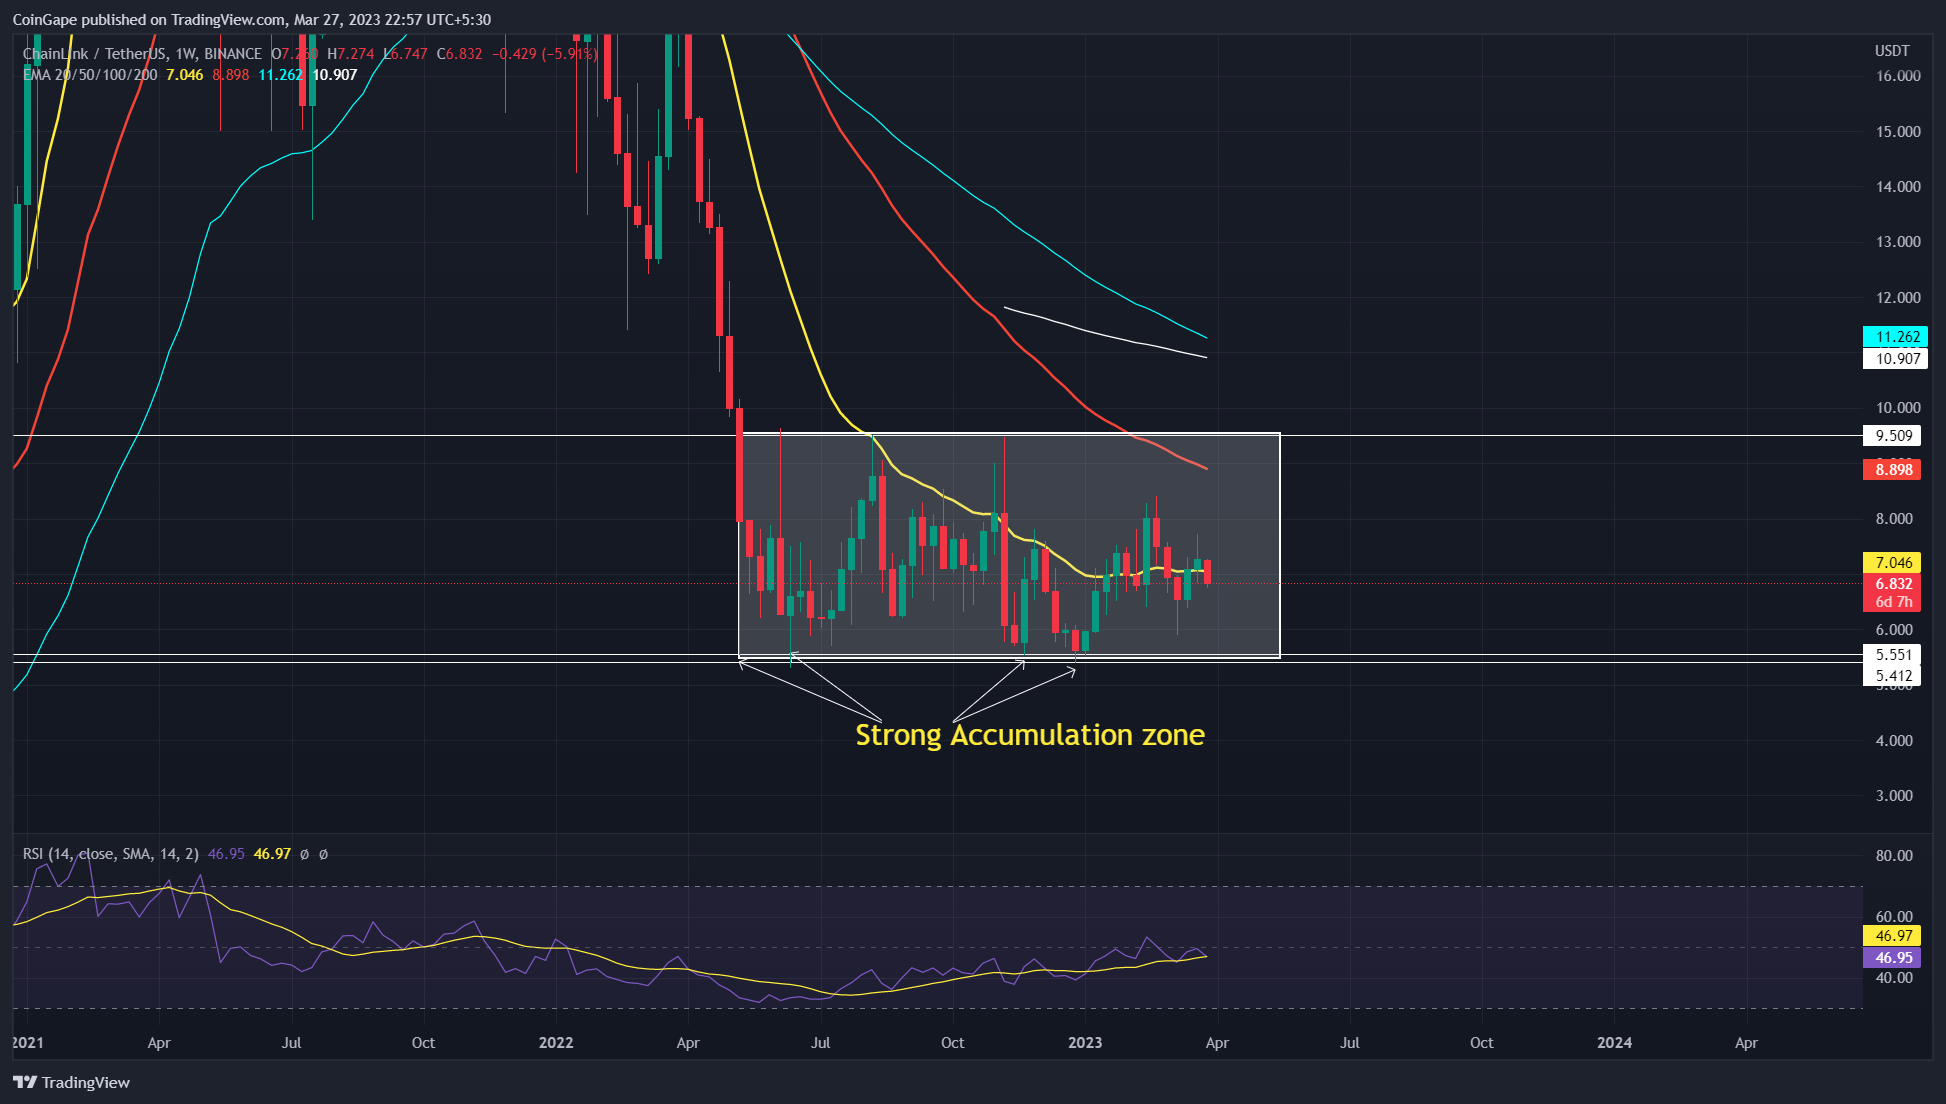
In the weekly time frame chart, the Chainlink price showed a clear sideways trend. Over the past ten months, the coin price has been resonating between the buying climax of $9.5 and the selling climax of $5.5.
However, despite this sideways trend, the weekly RSI slope rising higher indicates the underlying bullish momentum is growing. This bullish divergence indicates a higher possibility for the LINK price to breach the $9.5 resistance, offering a signal for trend reversal.
In addition, the traders can also look for an entry opportunity if the coin price plunged back to the high accumulation zone of $5.5.
Share this article on:
advertisement
The presented content may include the personal opinion of the author and is subject to market condition. Do your market research before investing in cryptocurrencies. The author or the publication does not hold any responsibility for your personal financial loss.
<!– Close Story–>
- SEO Powered Content & PR Distribution. Get Amplified Today.
- Platoblockchain. Web3 Metaverse Intelligence. Knowledge Amplified. Access Here.
- Source: https://coingape.com/markets/top-3-altcoins-set-to-resume-bullish-recovery-in-april-2023/
- :is
- $UP
- 1
- 10
- 2022
- 2023
- 7
- 8
- 9
- a
- accumulation
- active
- Ad
- addition
- aggressive
- Altcoins
- and
- April
- ARE
- article
- AS
- assist
- At
- Attempts
- author
- avatar
- back
- banner
- barrier
- base
- BE
- Beauty
- before
- between
- blockchain
- Bottom
- breach
- breakout
- Brian
- Bullish
- bullish divergence
- buyers
- Buying
- by
- CAN
- challenge
- Chart
- clear
- Coin
- Coingape
- COM
- condition
- content
- could
- crypto
- Crypto Market
- cryptocurrencies
- cryptocurrency
- Cryptocurrency Price
- Cryptocurrency Price Prediction
- Currently
- Despite
- different
- Discount
- Divergence
- double
- double bottom
- dynamic
- Early
- encourage
- Entertainment
- entry
- Ether (ETH)
- Failed
- famous
- Fashion
- finance
- financial
- follow
- For
- FRAME
- from
- Growing
- Have
- here
- High
- higher
- hold
- Horizontal
- HOURS
- HTTPS
- i
- in
- include
- Including
- increasing
- indicates
- influence
- interested
- investing
- journalism
- jpg
- Key
- Last
- leading
- Level
- likely
- LINK
- link price
- Liquid
- liquid staking
- local
- Look
- loss
- major
- Majority
- mark
- Market
- market research
- market sentiment
- minor
- Momentum
- months
- of
- offer
- offering
- on
- Opinion
- Opportunity
- past
- Pattern
- personal
- Platforms
- plato
- Plato Data Intelligence
- PlatoData
- plugin
- plunged
- possibility
- possible
- potential
- prediction
- presented
- press
- price
- Price Prediction
- price rally
- Publication
- Push
- rally
- reached
- Read
- recent
- recently
- recovery
- research
- Resistance
- responsibility
- resume
- Reversal
- rising
- rsi
- same
- Sellers
- Selling
- sentiment
- set
- several
- Share
- show
- Shows
- sideways
- sign
- Signal
- Signs
- Slope
- SOL
- Solana
- solana coin
- Solana Price
- some
- Staking
- steady
- subject
- support
- targets
- ten
- that
- The
- The Weekly
- These
- time
- to
- today
- top
- Topics
- traded
- Traders
- TradingView
- Trend
- trending
- Twice
- Uncertainty
- under
- underlying
- variety
- weekly
- which
- will
- with
- witnessed
- working
- written
- xrp
- XRP Price
- years
- Your
- zephyrnet