Bitcoin is still consolidating in the $36K-$46K range, as the bulls are trying to push the price higher after confirmation of the FED, raising the interest rate to 0.5% – a figure which was anticipated by the majority of analysts and market participants.
Technical Analysis:
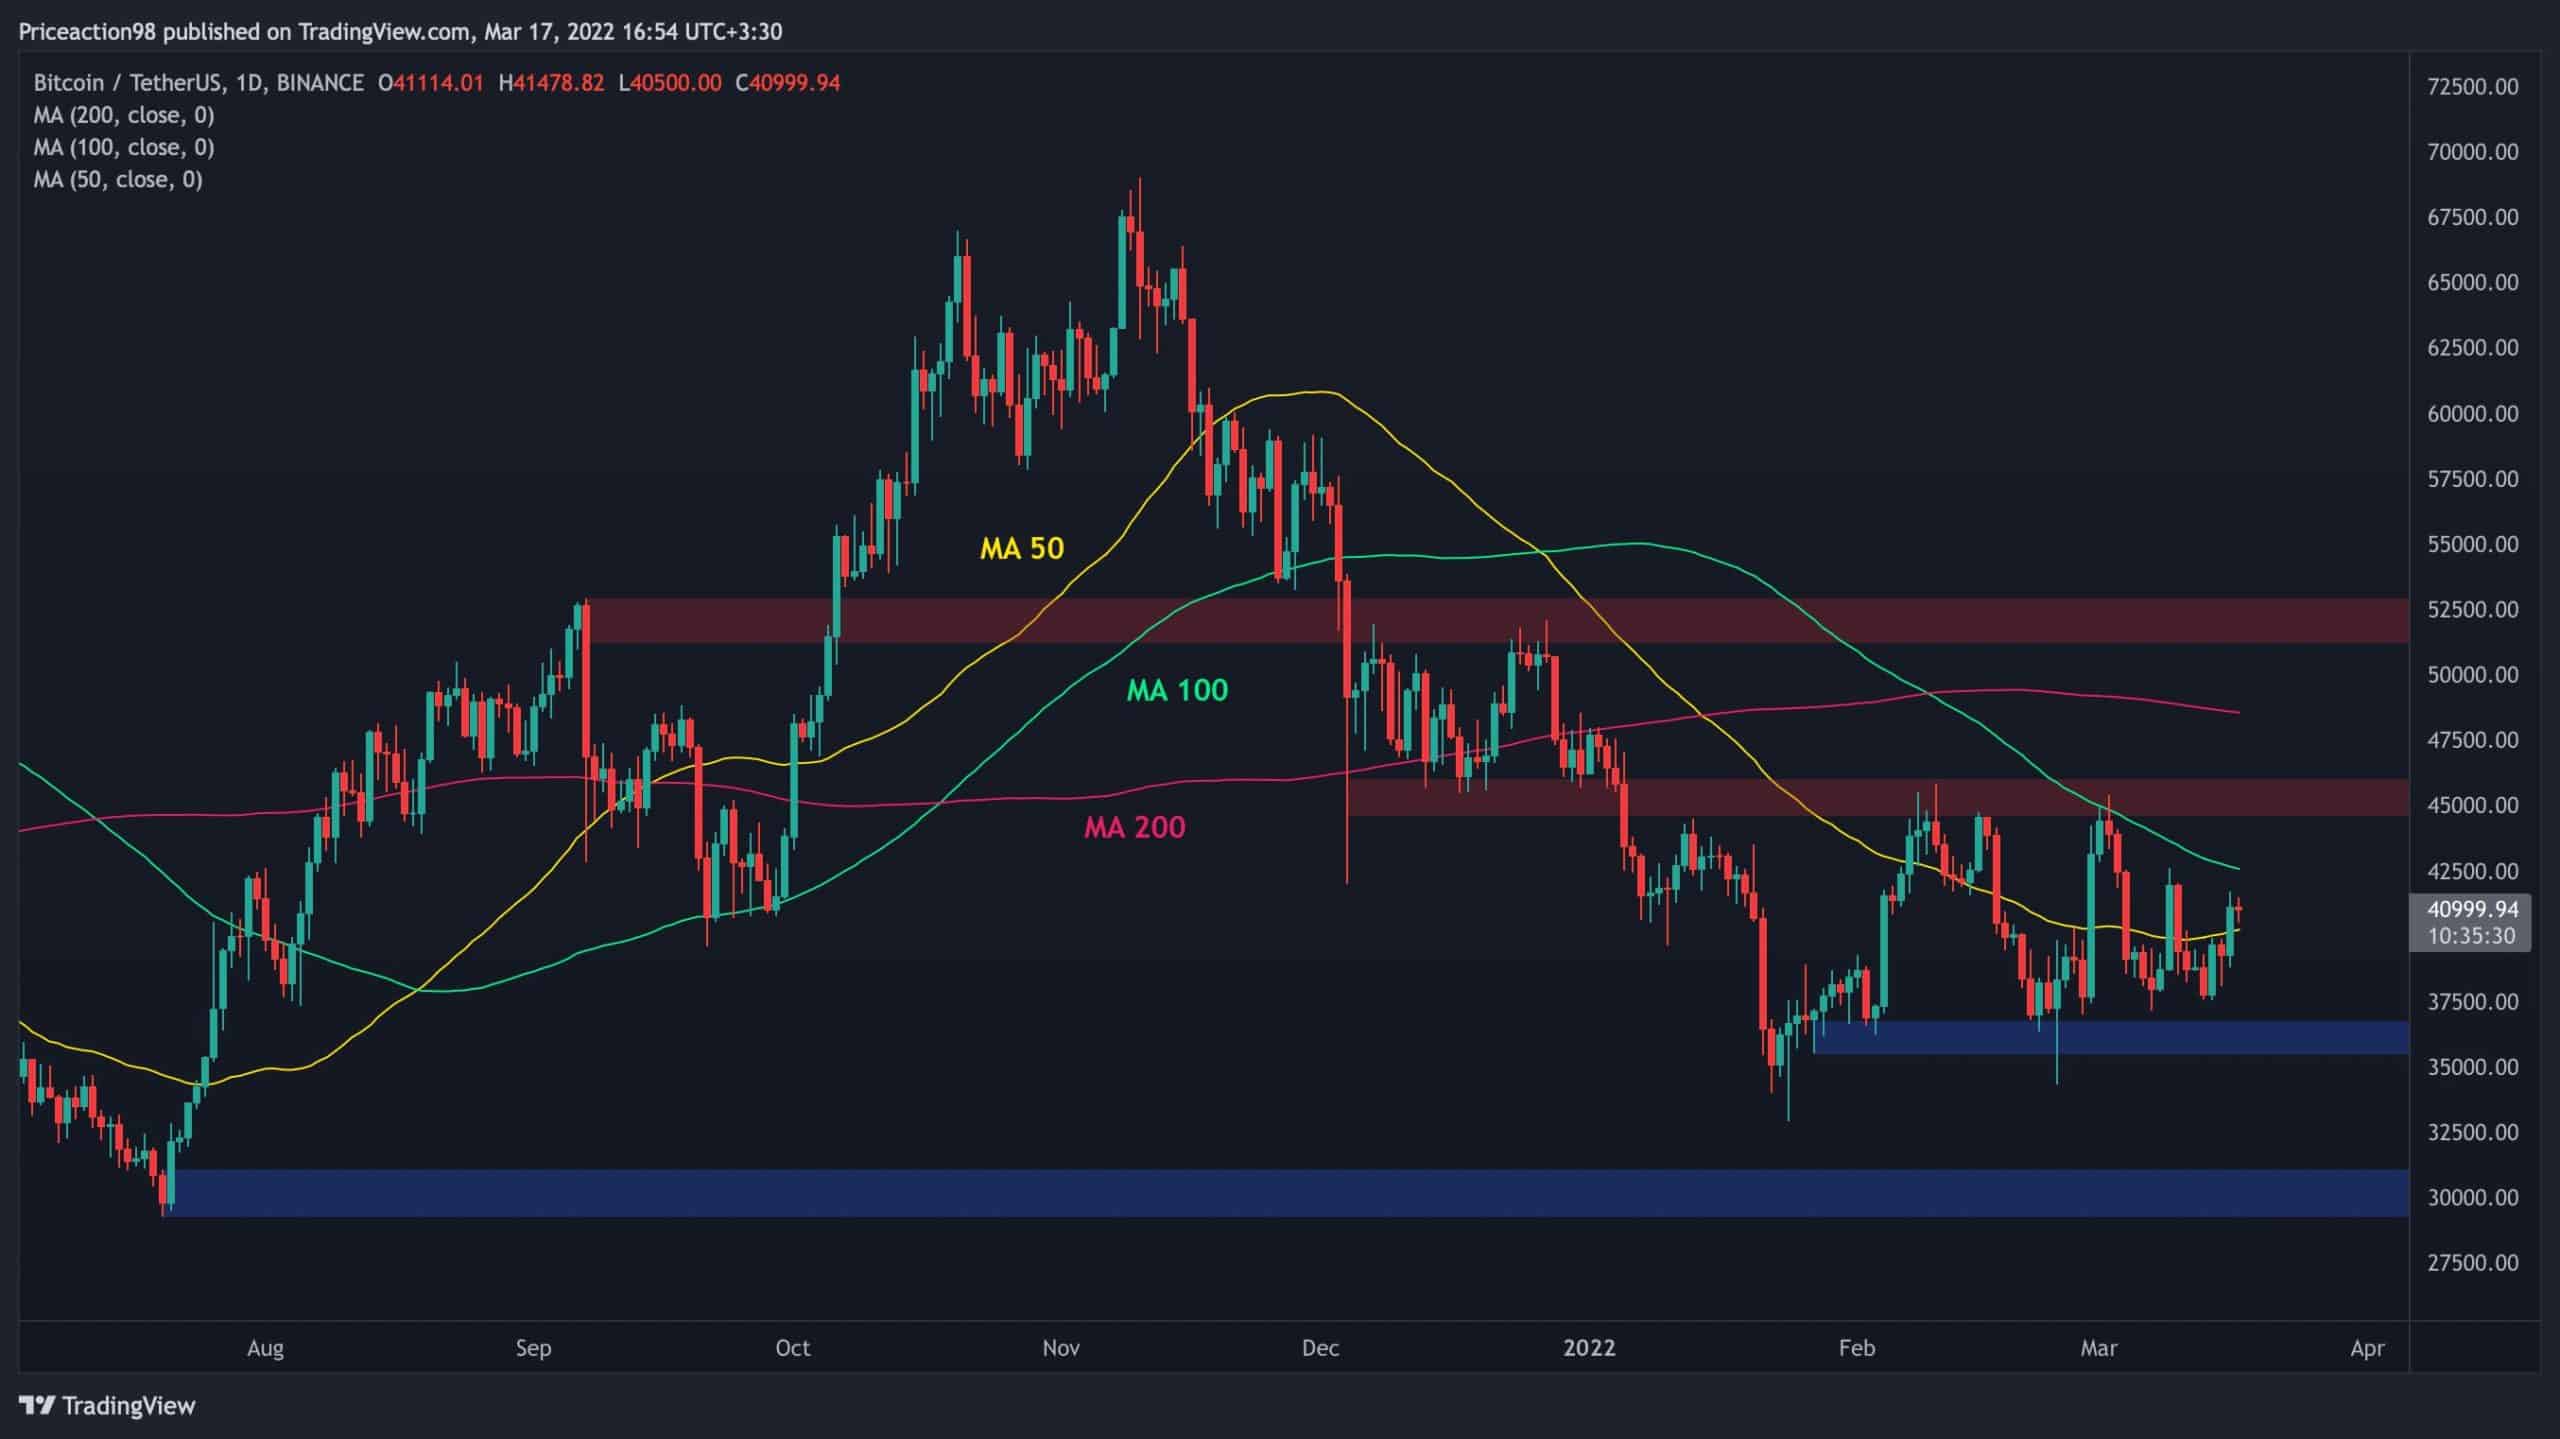
The Daily Chart:
Technical Analysis By: Edris
The price broke above the 50-day moving average once again and is currently approaching the 100-day moving average, which is the next dynamic resistance, ahead of the significant $46K zone.
If the price is able to reach the $46K zone, a bullish breakout would be probable as this level has already been tested multiple times, leading to lots of liquidity being created above this level in form of buy-stops. However, if the price gets rejected by the lower band again, the 50-day moving average and the $36K level could act as support and hold the price.
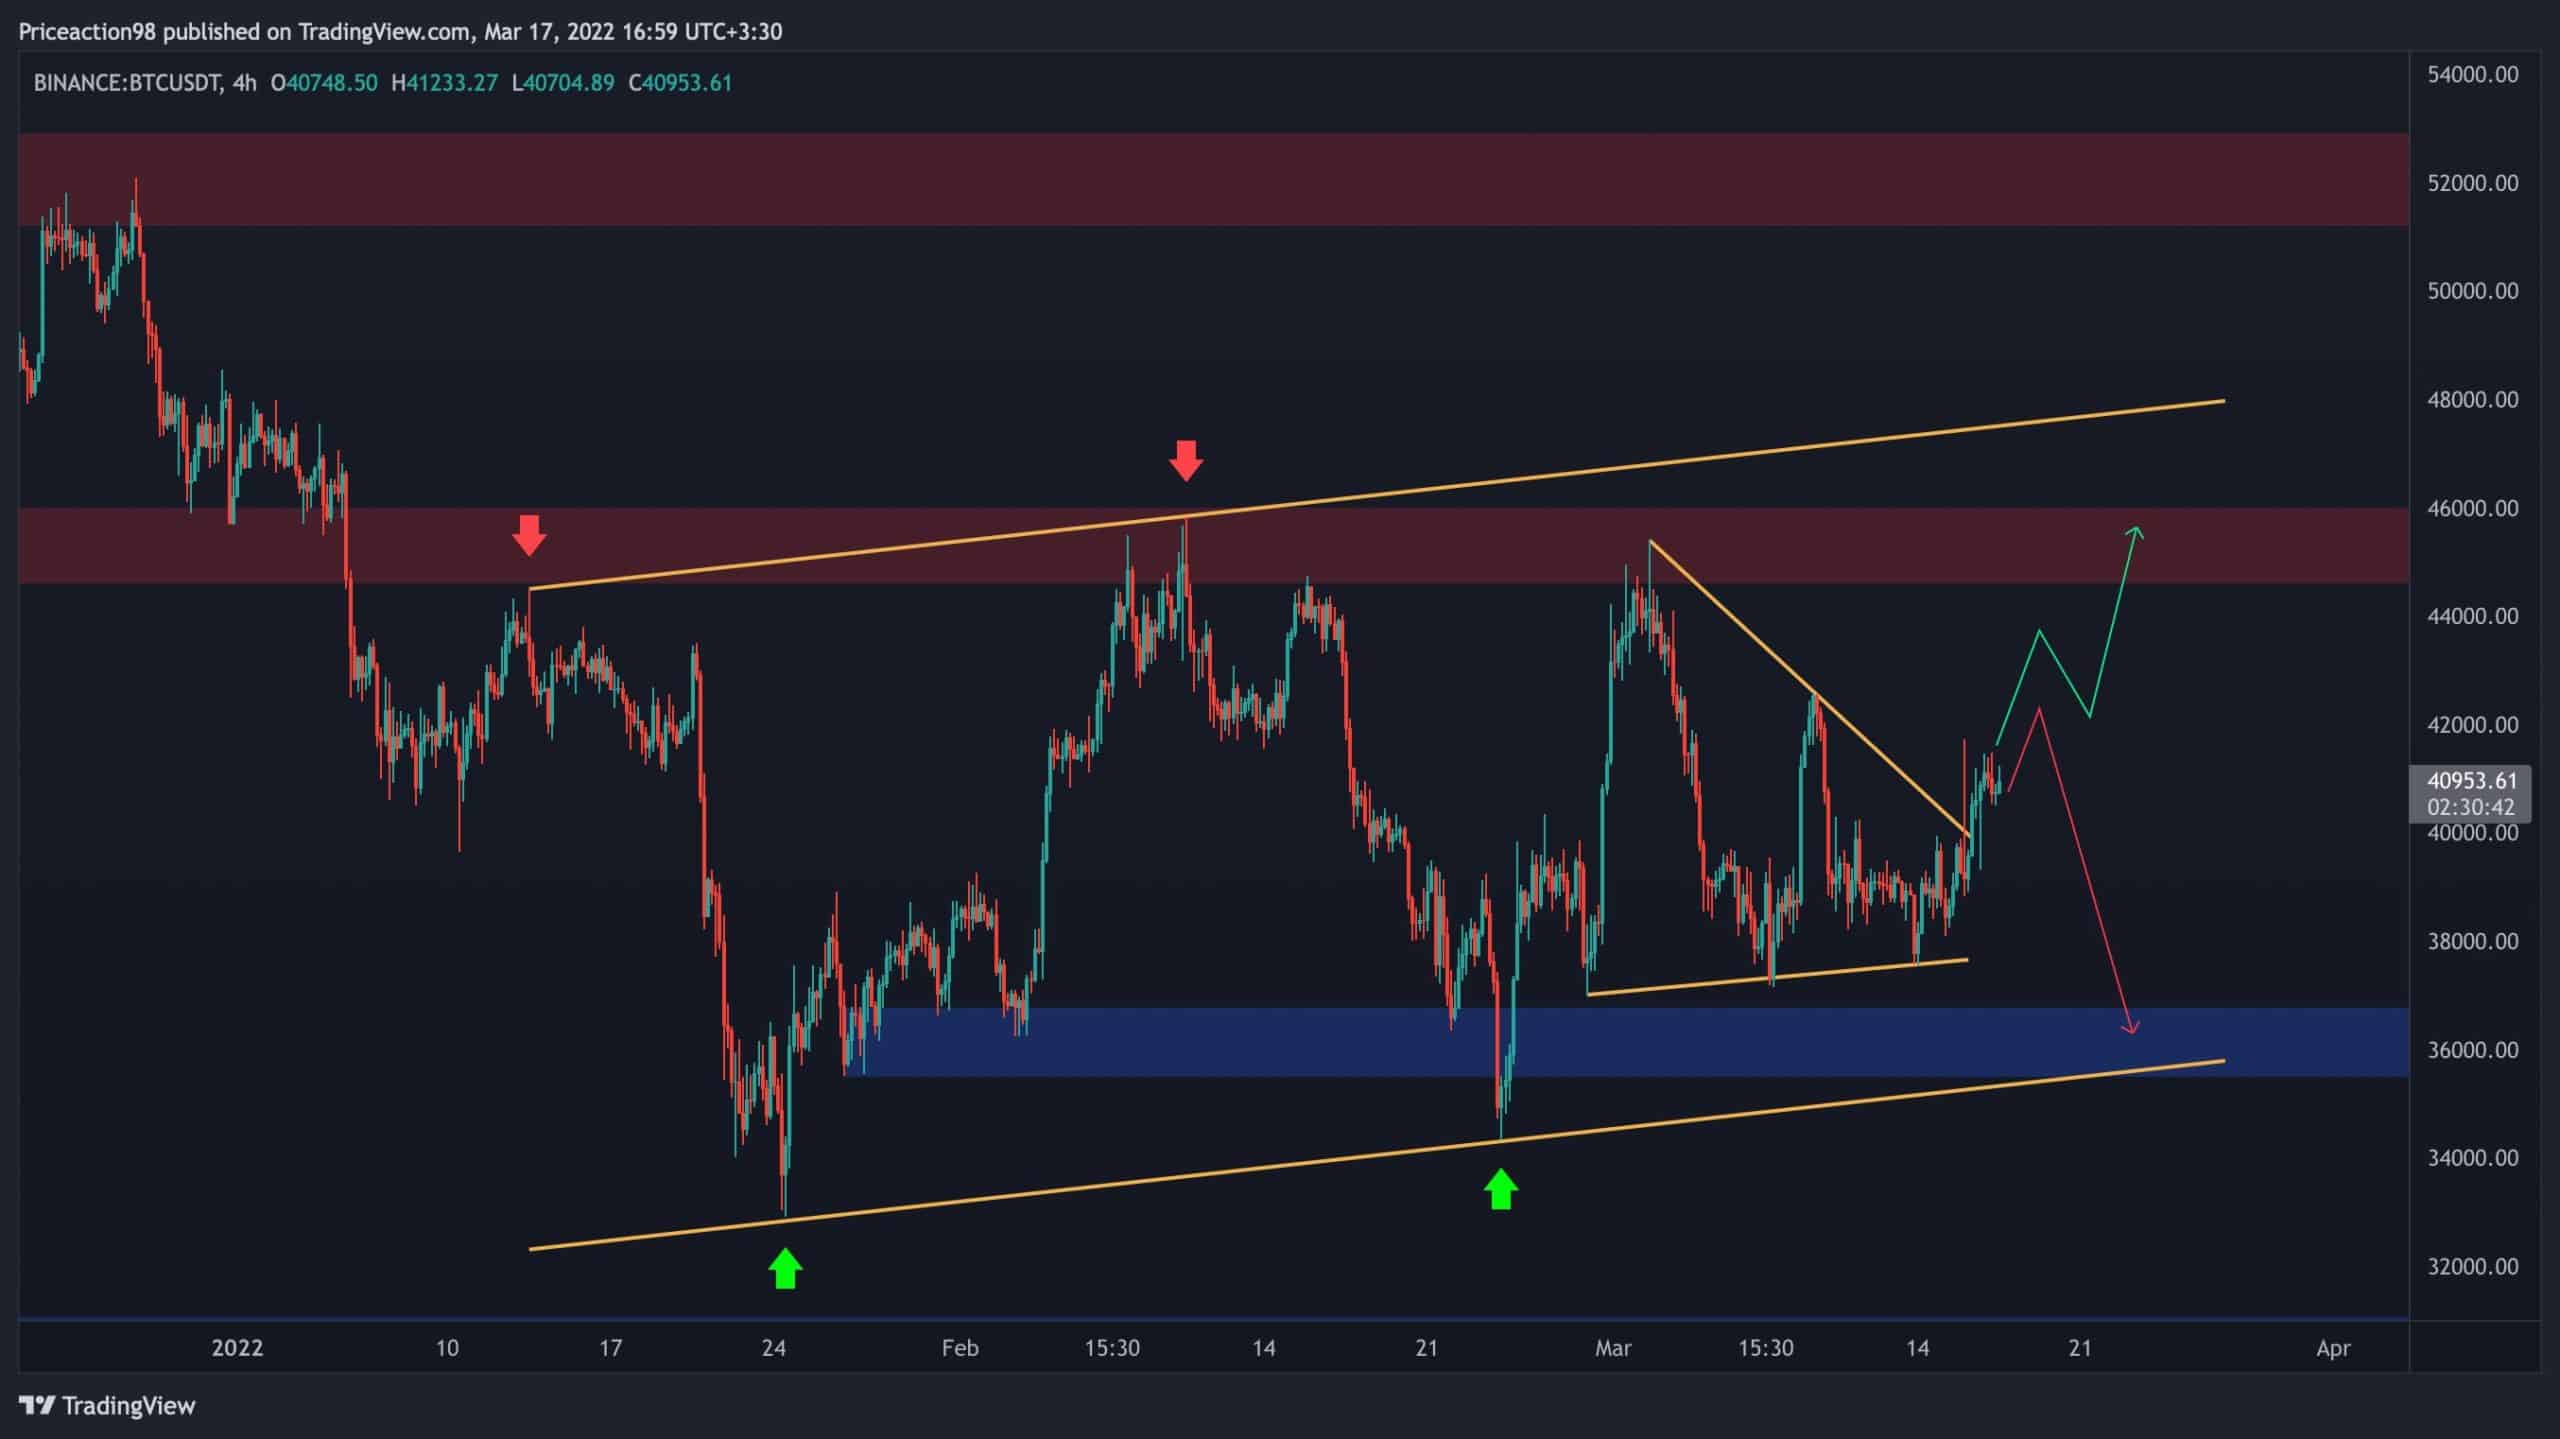
The 4-Hour Chart:
On the 4-hour timeframe, the price has broken the triangle pattern to the upside. There are two possible scenarios in this situation. The first one would be a minor correction and pullback to the broken trendline and a bullish recovery towards the $46K level, and next to the top of the large bearish flag.
A valid breakout above this flag would mean the price is likely to rally to the next key area, which is the $52K zone. The second scenario would be a bearish reversal back into the broken triangle pattern, which would make the initial breakout a fake one. As a result, the price would probably drop to the $36K support zone and test the lower boundary of the large flag. If these two supports fail to hold, the bearish flag continuation would be valid, and the price would likely crash in the short-term, making a new low below the $33K bottom.
Onchain Analysis:
Onchain Analysis By Shayan
Since late 2020, the exchange reserves metric has been in a downtrend. A sudden change in direction or surge in the measure has historically signaled a bullish/bearish indication for the price. As you can see in the graphic, every time there was a surge, the market went into a decline. In addition, anytime the indicator fell precipitously, bitcoin began a bullish bounce.
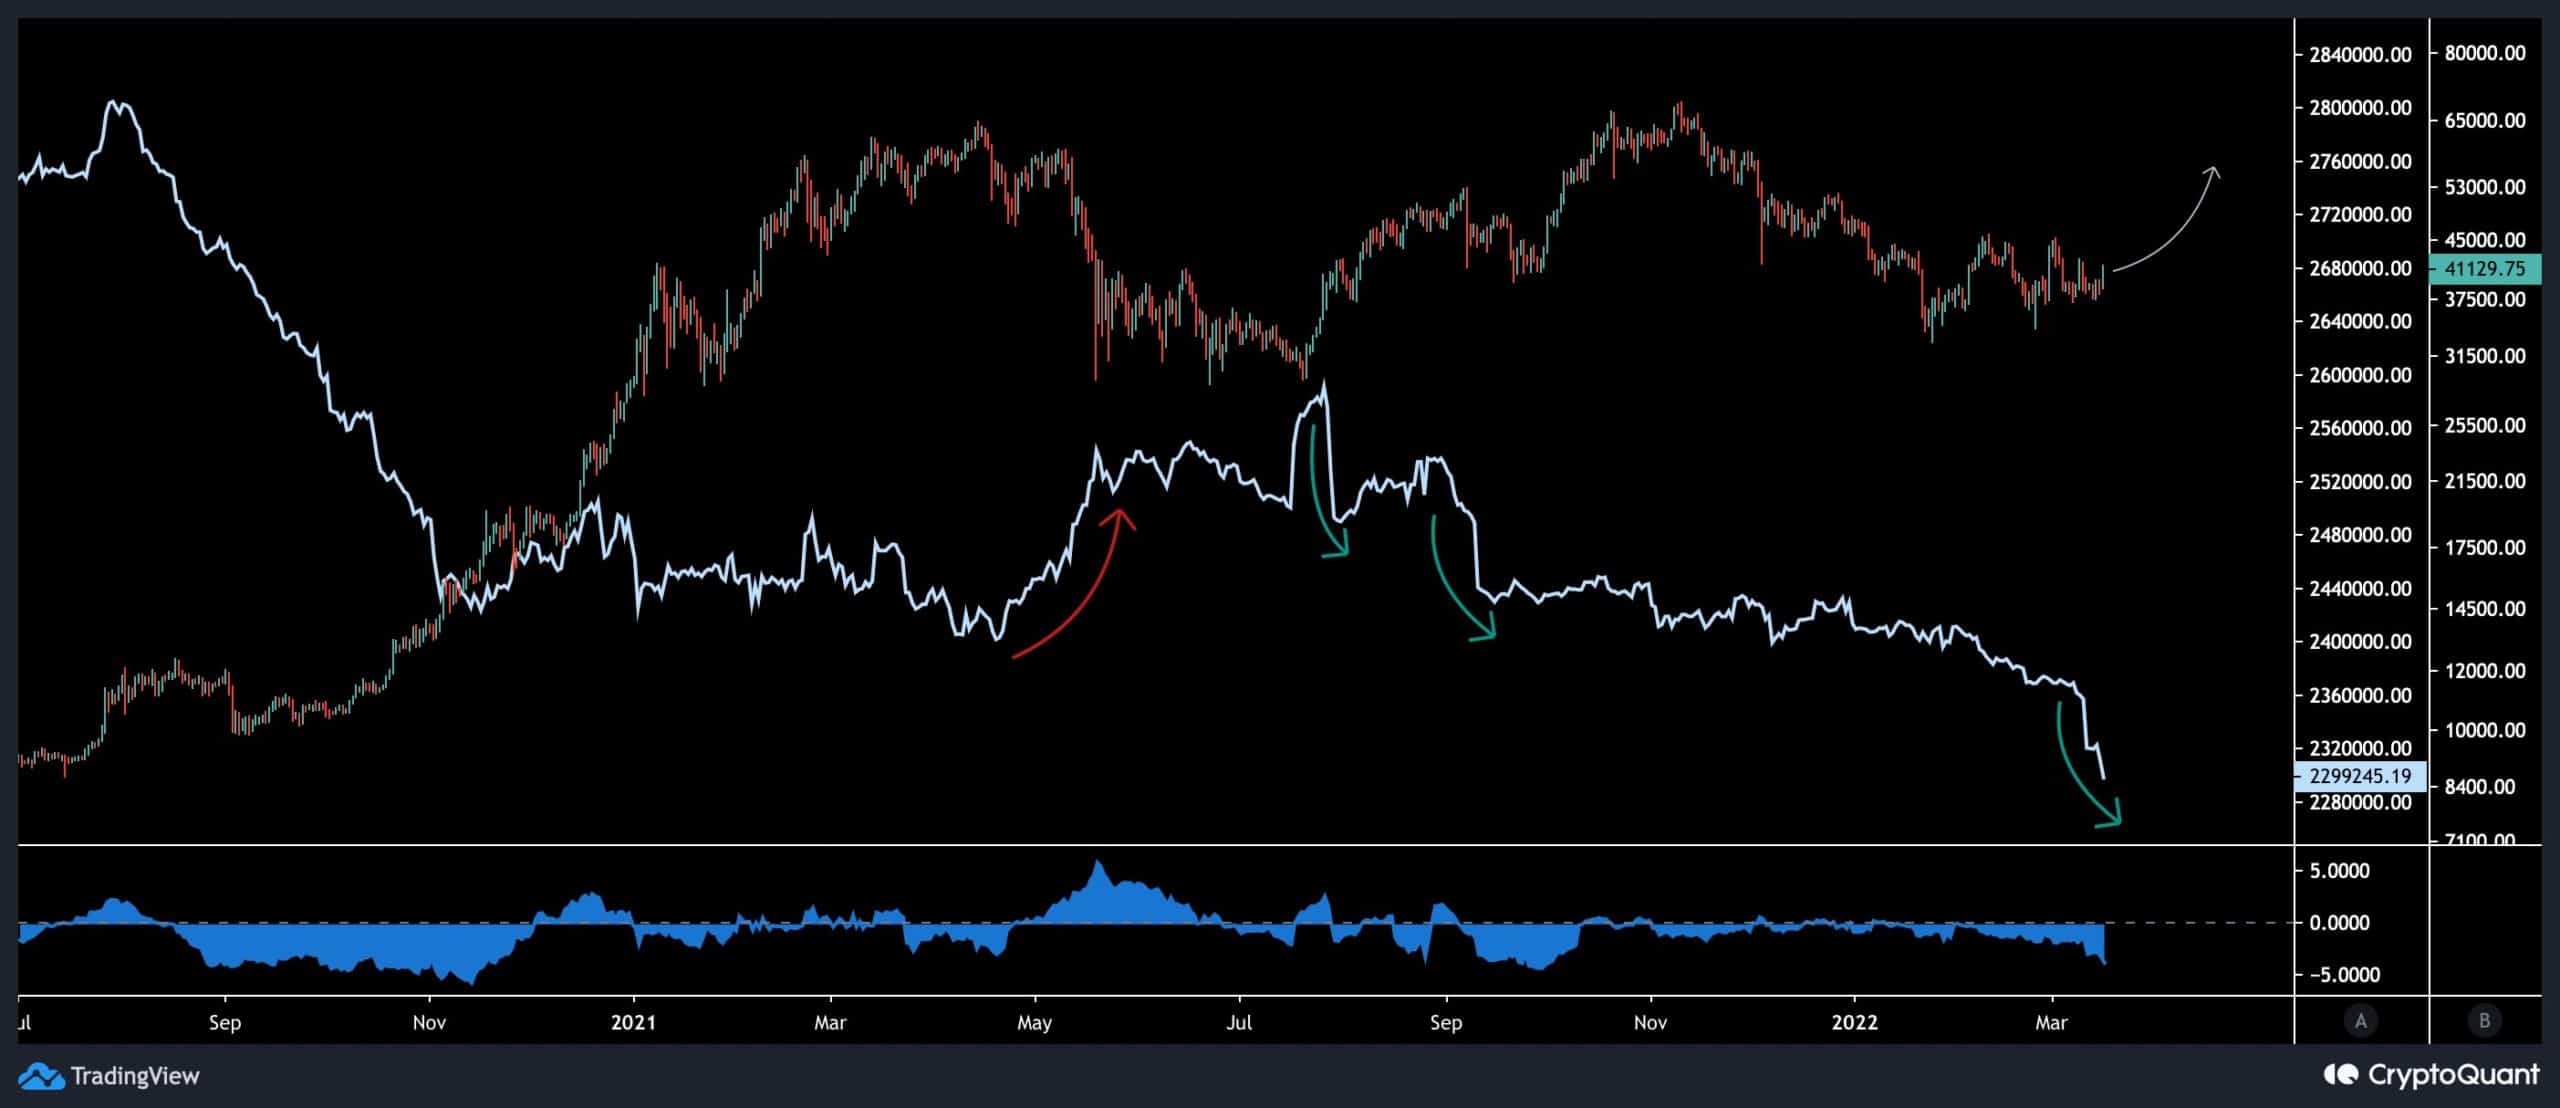
This metric has been in steep decline since before the FOMC meeting, and there is no hint of positive activity in the price yet. The market usually takes a bit to see the effect.
- 2020
- Act
- activity
- already
- analysis
- AREA
- average
- bearish
- being
- Bit
- Bitcoin
- breakout
- BTC
- btc price
- Bullish
- Bulls
- change
- could
- Crash
- Drop
- dynamic
- effect
- exchange
- fake
- Fed
- Figure
- First
- form
- hold
- HTTPS
- interest
- Key
- large
- leading
- Level
- Liquidity
- Majority
- Making
- Market
- measure
- moving
- participants
- Pattern
- positive
- possible
- price
- Price Analysis
- rally
- range
- recovery
- significant
- support
- Supports
- surge
- test
- time
- timeframe
- top
- usually