Introduction to GameFi
As the fastest-growing segment of the blockchain industry, GameFi has attracted tons of attention from crypto enthusiasts, investors, and has started generating mainstream interest. Since 2019, they have been over 3,000 GameFi projects launched across 114 chains.
Many of these games have similar elements, but some rework elements interact in innovative ways. Aside from the gameplay itself, GameFi projects are built on the strength of their tokenomics—otherwise, they’re just high-barrier games.
But how can you assess tokenomics and fundamentals? We aim to make dashboards that help users do exactly that at Footprint Analytics.
STEP 1: Explore dashboards related to the project and ecosystem.

Footprint Analytics Homepage
At Footprint Analytics, there are over 6,000 dashboards about protocols, ecosystems, and projects, with 15 more being made every day. Since dashboards are community-made, they each show different data that the creator thought relevant. Therefore, it helps to open several different dashboards to analyze the project from different angles.
STEP 2: Look for project health signals
In a previous article from Footprint, we outlined the things people should look for when analyzing a DeFi project. These include:
- Stable TVL Growth
- Low Market Cap-to-TVL ratio
- Stable token price and sustainable growth
Footprint Analytics – How to Discover Valuable Projects
While some of these metrics are relevant for GameFi, as DeFi is the core of blockchain games, you should put more emphasis on user metrics that point to useability.
For example:
- Stable player growth
- No drastic crashes
- Token price correlating logically with other metrics
Something you don’t want to see:

Footprint Analytics – New Users vs Daily Retention of Starsharks
This sharp drop indicates a problem with the game or ecosystem. It can also mean a rug pull or hack. Specifically, eliminate daily tasks and slot machines to reduce the output of SEA, adding the claim SEA condition restricts the circulation of SEA, and removing the rental marketplace.
On the other hand, charts from Crazy Defense Heroes show natural ebbs and flows which correlate to the token price, indicating that the game can sustain periods of decreased interest without collapsing outright.

Footprint Analytics – Crazy Defense Heroes

Footprint Analytics – Crazy Defense Heroes
This is telling, considering that CDH has been around for a long time. If you invest in in-game NFTs, you bank on the fact that the game will continue generating predictable returns for a given period to pay off the initial investment in NFT assets.
STEP 3: Consider the chain the game is built on
As chains increase in popularity, they build mass that draws more users to their projects. The popularity of a chain will have a multiplying effect on their projects’ popularity because a thriving ecosystem allows more options for bridging, lending, and other DeFi functions.

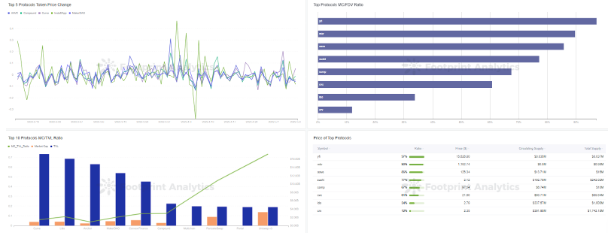
Footprint Analytics – GameFi User Distribution

Footprint Analytics – GameFi User Rate by Chain

Footprint Analytics – GameFi Users Overview by Marketcap
Other things to look at include the transaction rate and token price. GameFi projects built on relatively expensive and slow chains, like Cronos, are likely to run into scaling issues. (It’s not surprising that Cronos remains an unpopular chain for GameFi.)
For another example, Ethereum GameFi projects also seem to have trouble breaking into the top titles. Due to expensive gas fees and low user growth rate.

Footprint Analytics – Gas Prices by Day

Footprint Analytics – Ranking of Daily Gamers

Footprint Analytics – Comparison of GameFi Users & Protocol Number
Before investing in new projects on Ethereum, e.g. NFTWorlds, it is necessary to perform due diligence about the project’s future scalability issues.
On the other hand, you can be sure that if a game is launched on WAX, it will not be hindered by the underlying blockchain platform on which it is built.
What is Footprint Analytics
Footprint Analytics is an all-in-one analysis platform to visualize blockchain data and discover insights. It cleans and integrates on-chain data so users of any experience level can quickly start researching tokens, projects and protocols. With over a thousand dashboard templates plus a drag-and-drop interface, anyone can build their own customized charts in minutes. Uncover blockchain data and invest smarter with Footprint.
Data Source: Footprint Analytics
- "
- &
- 11
- About
- across
- analysis
- analytics
- Another
- anyone
- around
- article
- Assets
- attention
- Bank
- being
- blockchain
- Blockchain games
- blockchain industry
- build
- chain
- Charts
- claim
- condition
- continue
- Core
- creator
- crypto
- dashboard
- data
- day
- Defense
- DeFi
- different
- diligence
- Drop
- ecosystem
- Ecosystems
- effect
- elements
- eliminate
- emphasis
- ethereum
- example
- experience
- explore
- Fees
- Footprint
- Footprint Analytics
- functions
- Fundamentals
- future
- game
- Gamefi
- gameplay
- Games
- GAS
- gas fees
- generating
- Growth
- hack
- Health
- help
- helps
- How
- How To
- HTTPS
- in-game
- include
- Increase
- industry
- innovative
- insights
- interest
- Interface
- investing
- investment
- Investors
- issues
- IT
- itself
- launched
- lending
- Level
- likely
- Long
- Machines
- made
- Mainstream
- Market
- marketplace
- Metrics
- more
- multiplying
- Natural
- necessary
- NFT
- NFTs
- On-Chain
- open
- Options
- Other
- own
- Pay
- People
- period
- periods
- platform
- player
- Point
- popularity
- previous
- price
- Problem
- project
- projects
- protocol
- protocols
- quickly
- RE
- reduce
- relevant
- remains
- removing
- returns
- Run
- Scalability
- scaling
- SEA
- segment
- several
- similar
- So
- some
- specifically
- start
- started
- strength
- sustainable
- tasks
- templates
- therefore
- time
- token
- tokenomics
- Tokens
- tons
- top
- transaction
- trouble
- uncover
- users
- WAX
- without