Be[In]Crypto takes a look at bitcoin (BTC) on-chain indicators, specifically the Spent Output Profit Ratio (SOPR) and the RHODL Ratio.
Bitcoin SOPR
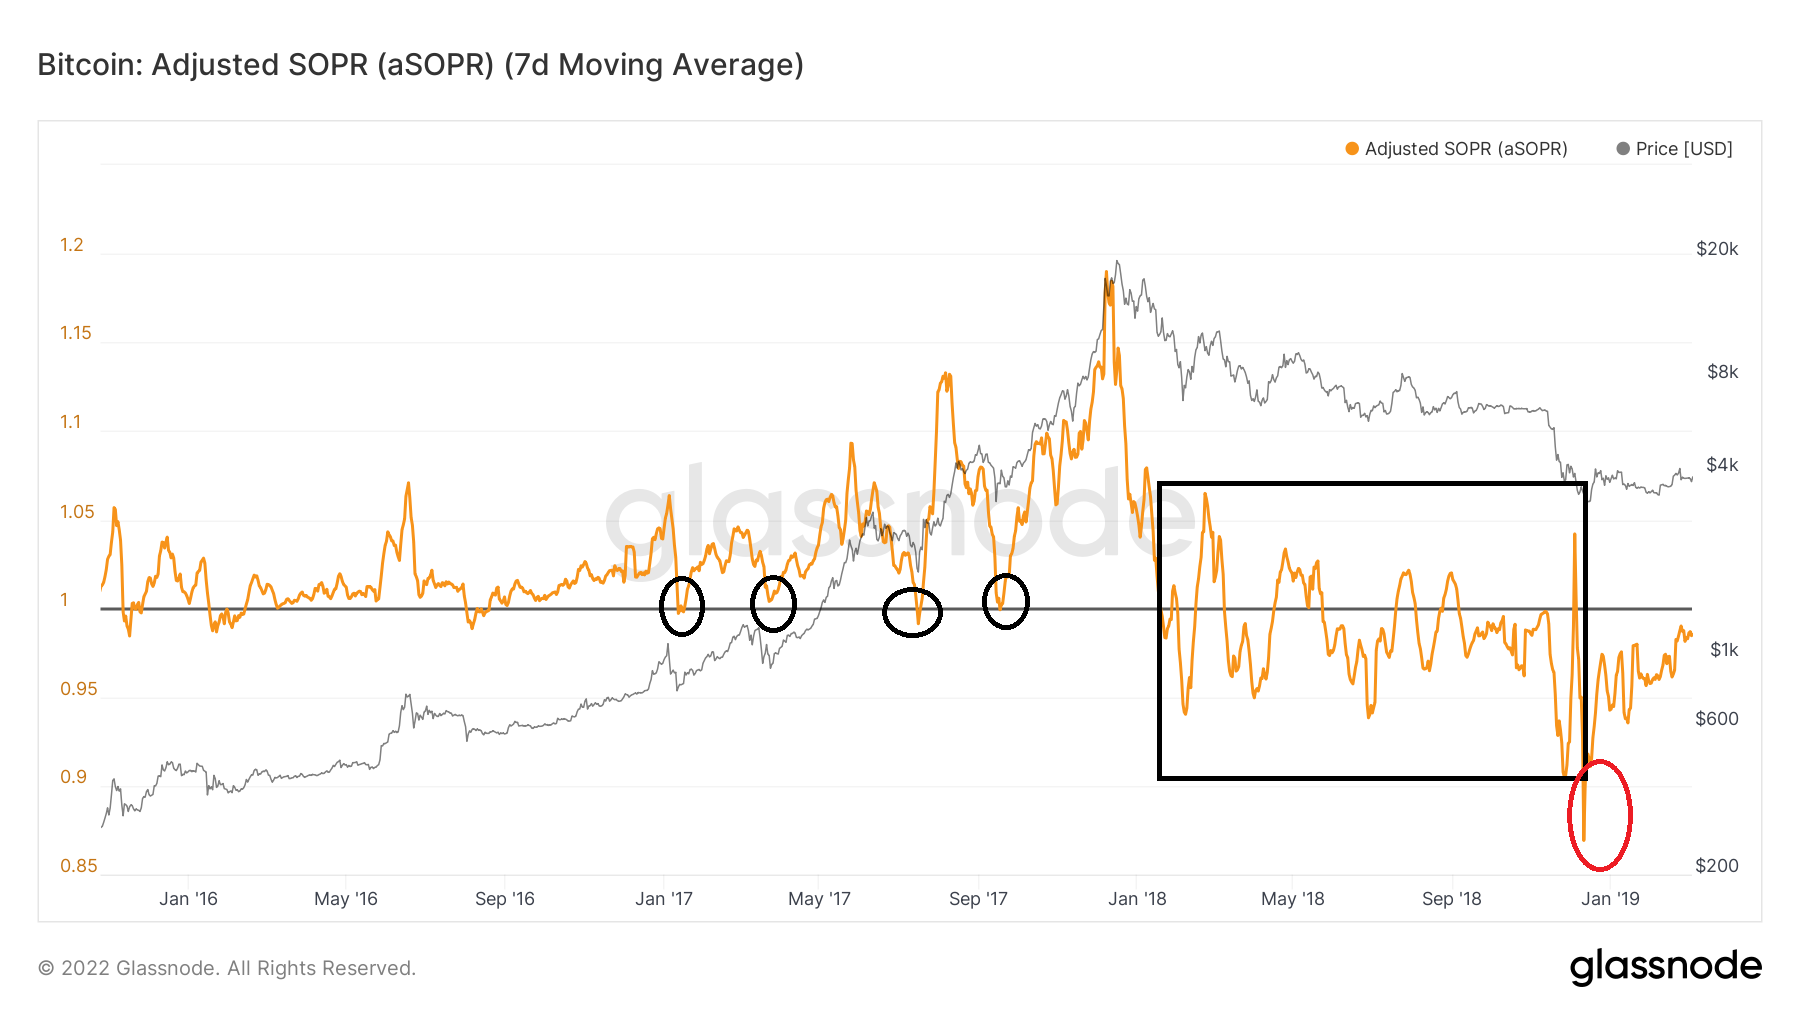
SOPR is an on-chain indicator that shows if the market is in a state of profit or loss. Readings above one (black line) show that the market is in aggregate profit, while those below one show aggregate loss.
One characteristic of bullish trends is that SOPR bounces at one line and does not fall below it.
This was visible in the 2016-2018 bull market when the indicator bounced at the one line four times (black circles) after breaking out.
Afterward, it entered a period in which SOPR moved freely above and below one for nearly one year (black rectangle). This is a sign of an undetermined trend. However, when it comes after such a sustained bullish rally, it usually means that the bullish trend has ended.
This period ended with the Dec. 2018 capitulation, in which SOPR dropped to 0.86 (Red circle). BTC began a new bullish trend afterward.
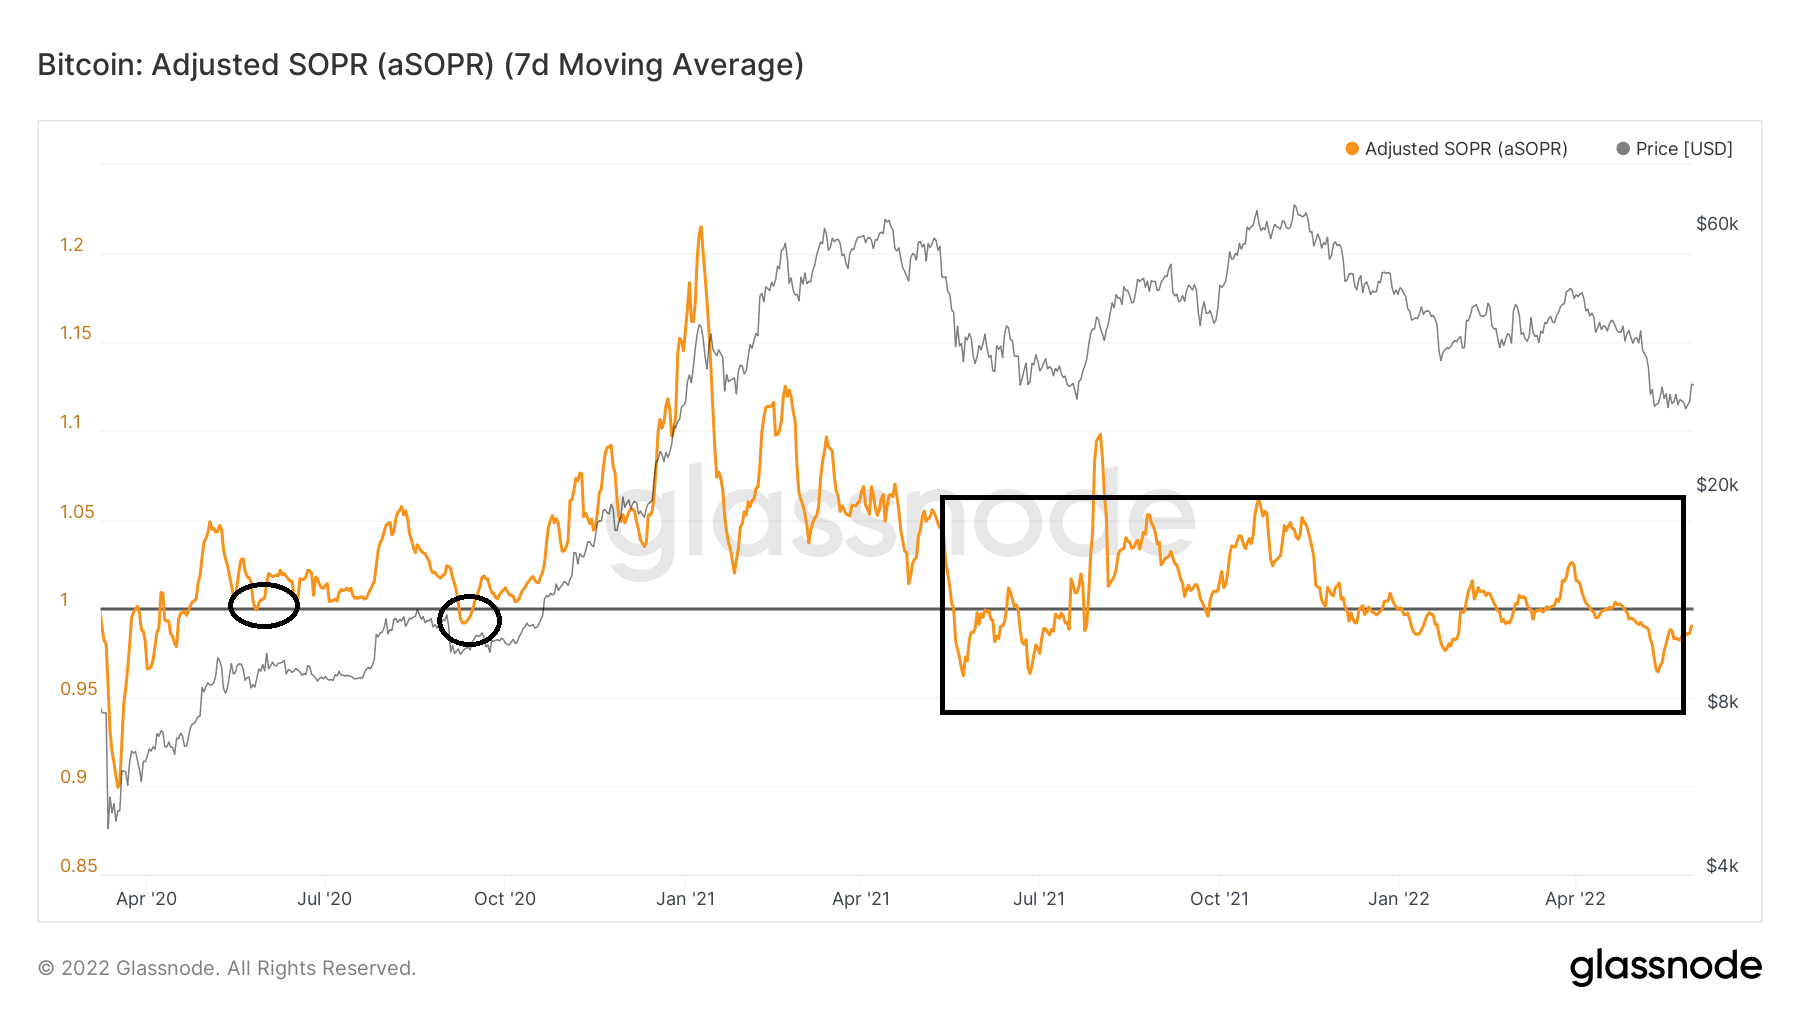
The current bull run was much shorter according to the SOPR, since the indicator bounced only twice at the one line (black circles).
Since May 2021, it has been moving freely above and below one, similarly to how it did in 2018. But, there has not been a capitulation event similar to the one in Dec. 2018. As a result, it is possible that one will eventually occur prior to the bottom.
RHODL Ratio
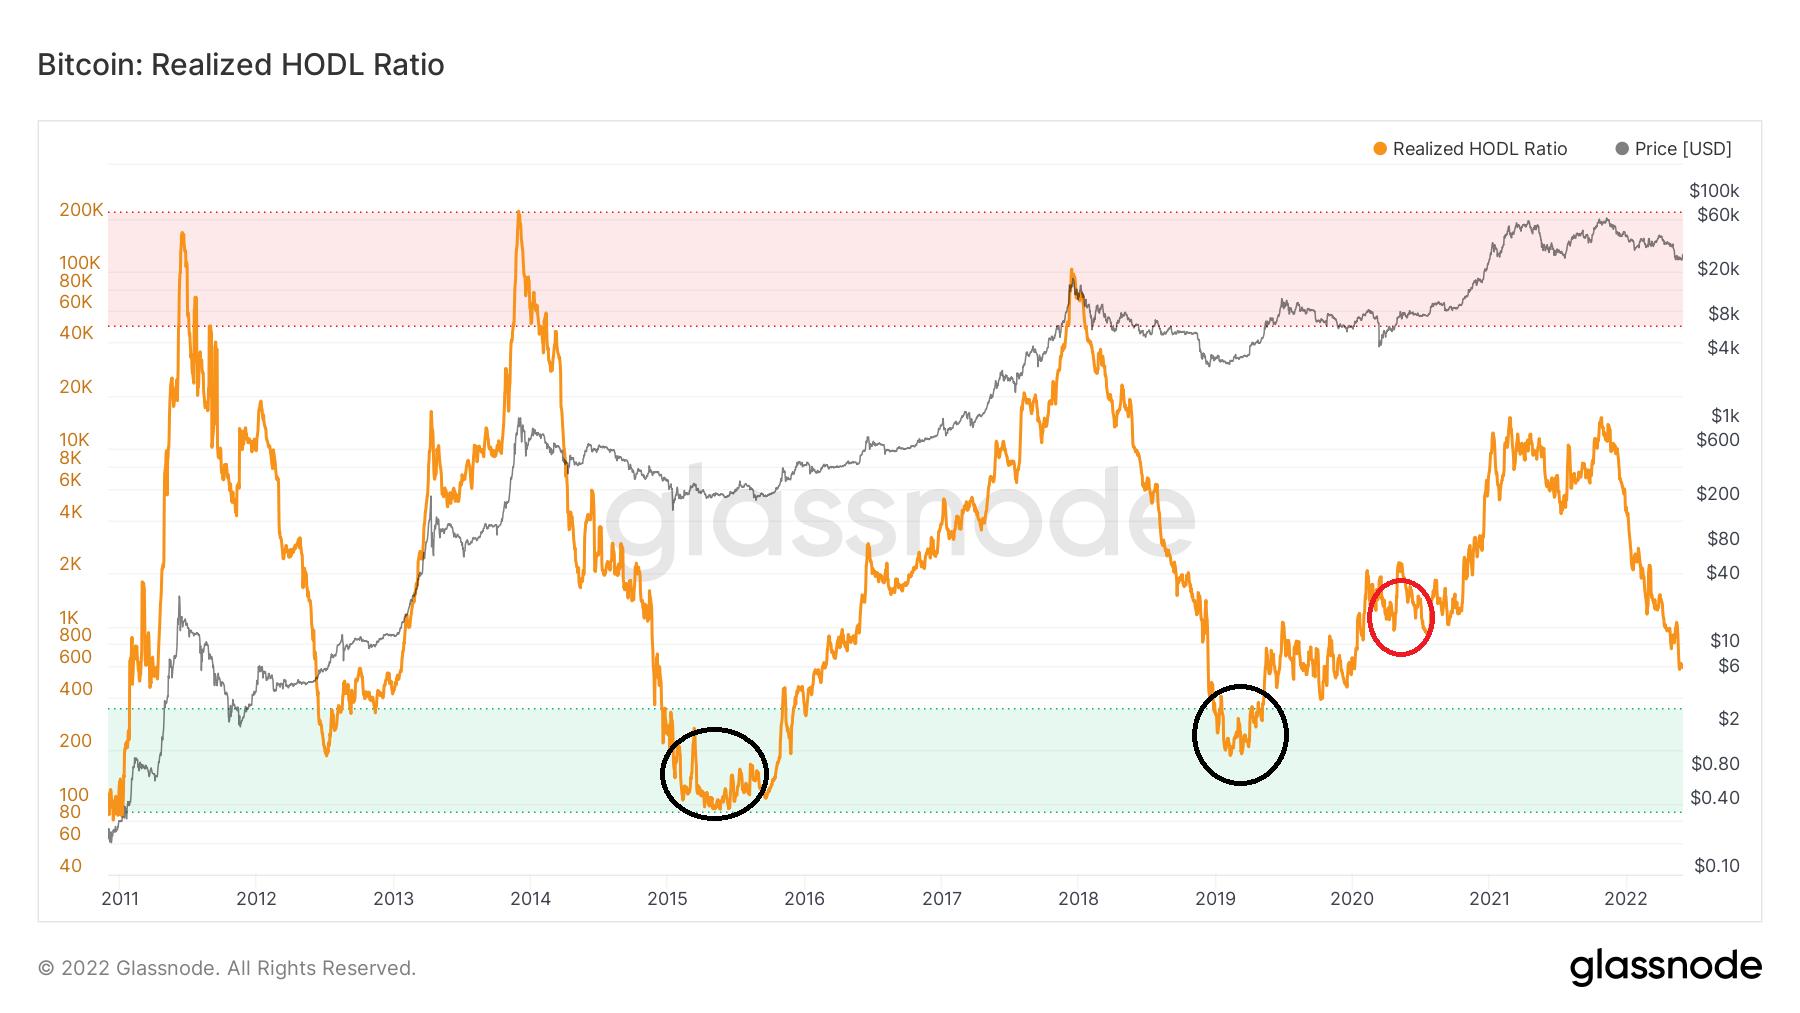
The RHODL ratio is an indicator created by taking the ratio between the 1-week and the 1-2 year HODL Wave bands. Values above 50,000 (highlighted in red) suggest that a significant percentage of the BTC supply is held by short-term holders. Historically, these values have coincided with market tops — which was the case at the 2013 and 2017 peaks.
That is not the case currently, since the long-term HODL waves are currently close to an all-time high.
The RHODL ratio is currently at 617, which is above the 300 ratio that is considered oversold. Previous bottoms (black circles) have been reached inside this ratio.
Similar to the SOPR chart, this suggests that a capitulation event is still possible prior to a bottom.
However, this has not always been the case, since the March 2020 bottom was reached at a ratio of 1,100 (red circle).
For Be[in]Crypto’s latest bitcoin (BTC) analysis, click here
The post Bitcoin (BTC) On-Chain Analysis: SOPR Has Not Yet Reached Capitulation Levels appeared first on BeInCrypto.
- 000
- 100
- 2020
- 2021
- According
- always
- analysis
- began
- below
- Bitcoin
- Black
- BTC
- Bull Run
- Bullish
- Circle
- created
- Current
- Currently
- DID
- dropped
- entered
- Event
- First
- Glassnode
- Highlighted
- HODL
- holders
- How
- However
- HTTPS
- IT
- latest
- Line
- long-term
- Look
- March
- march 2020
- Market
- means
- moving
- On-Chain
- percentage
- period
- possible
- previous
- Profit
- rally
- Run
- short-term
- sign
- significant
- similar
- Similarly
- since
- specifically
- State
- supply
- taking
- The
- times
- Trends
- usually
- visible
- Wave
- waves
- while
- year