Introduction
In today’s business world, customer care service plays an important role in ensuring loyalty and customer satisfaction. Understanding and analyzing the sentiments expressed during interactions can help enhance the quality of customer care. Sentiment analysis on customer care audio data acts as a powerful tool for achieving this goal. In this comprehensive guide, we will explore the complexities of conducting sentiment analysis on customer care audio recordings, providing a detailed roadmap for implementation.

Learning Objectives
- Learn to build a Flask web application that uses AWS.
- Learn the procedure of conducting sentiment analysis.
- Learn the calculations involved in sentiment analysis.
- Understand how to extract the required data and gain insights from this analysis.
This article was published as a part of the Data Science Blogathon.
Table of Contents
Procedure of Performing Sentiment Analysis
Stage 1: Preparing the Data
Understanding the Task: To perform sentiment analysis on the customer care audios available and provide insights from the results.
Creating a Flask Application: Building a Flask web application that uses Amazon Web Services (AWS) comprehend to do analysis. This application is the foundation for our project.
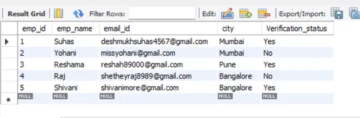
Uploading Audio Recordings: The call recording should be stored in a database like an AWS S3 bucket to start the analysis.
Developing User Interface: Creating a user-friendly interface is very crucial. This is achieved using CSS, HTML, and JavaScript. This interface helps users to select names, dates, and times.
Getting the Inputs: User inputs like Names, Beginning Date and Time, and End Date and Time are captured to customize the analysis process.
Fetching Recordings: Guidance to fetch recordings from the S3 bucket within the selected time interval is given.
Audio Transcription: The heart of sentiment analysis lies in the transcribed text. This section explores how AWS Transcribe converts spoken words from the available recordings into text for
analysis.
Stage 2: Analyzing the Data
Performing Sentiment Analysis: Analyzing the transcribed text is important for this guide. The first step of this phase is to divide large volumes of text into manageable chunks. The next step is to perform sentiment analysis on each chunk.
Calculating Sentiment Metrics: The next is to derive meaningful insights. We will calculate the average of all sentiment scores and calculate the Net Promoter Score (NPS). NPS is a critical metric that quantifies customer or employee loyalty. The formula for NPS is as follows:
NPS = ((Total Positives / Total
Records) – (Total Negatives / Total Records)) * 100
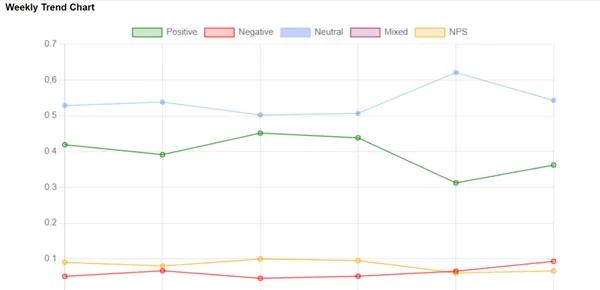
Creating Trend Charts: This helps to Understand trends over time. We’ll guide you to create visual trend charts that illustrate the progress of sentiment scores. These charts will cover positive, negative,
mixed, and neutral values and NPS.
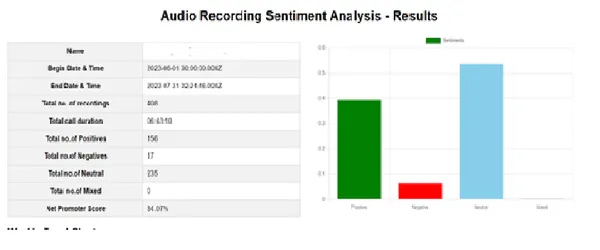
Result Page: At the final step of our analysis, we’ll create a result page that showcases the result of our analysis. This page will present a report on sentiment metrics, trend charts, and actionable insights
drawn from customer care interactions.
Now let’s begin our sentiment analysis, following the above procedure.
Importing Necessary Libraries
In this section, we import essential Python libraries that are fundamental to building our Flask application, interacting with AWS services, and performing various other tasks.
from flask import Flask, render_template, request
import boto3
import json
import time
import urllib.request
import requests
import os
import pymysql
import re
import sys
import uuid
from datetime import datetime
import json
import csv
from io import StringIO
import urllib
Uploading Audio Recordings
Before starting our call recording analysis, the recordings must be easily accessible. Storing the recordings in locations such as an AWS S3 bucket helps in easy retrieval. In this study, we have uploaded the
employee and customer recordings as separate recordings in a single folder.
Creating User Interface
Using CSS, HTML, and JavaScript, a visually appealing user interface is created for this application. This helps the user to select inputs such as Names and dates from the provided widgets.
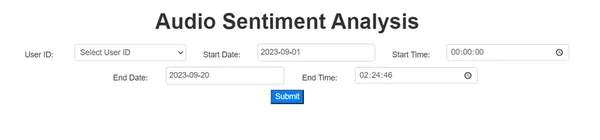
Getting the Inputs
We use our Flask application to get information from the user. To do this, we use the POST method to gather details like employee names and date ranges. We can then analyze the sentiments of both the employee and the customer. In our demonstration, we are using the employee’s call recordings for analysis. We can also use the call recordings of the customers who interact with the employee instead of the employee’s calls.
We can use the following code for this.
@app.route('/fetch_data', methods=['POST'])
def fetch_data(): name = request.form.get('name') begin_date = request.form.get('begin_date') begin_time = request.form.get('begin_time') begin_datetime_str = f"{begin_date}T{begin_time}.000Z" print('Begin time:',begin_datetime_str) end_date = request.form.get('end_date') end_time = request.form.get('end_time') end_datetime_str = f"{end_date}T{end_time}.000Z"
Fetching Recordings
To begin our analysis, we need to get the audio recordings from their stored location. Whether they’re in an AWS S3 bucket or some other database, we have to follow certain steps to get these recordings, especially for a specific time period. We should make sure we provide the right folders containing the recordings of employees or customers.
This example shows how to get recordings from an S3 bucket.
# Initialize the S3 client
s3 = boto3.client('s3') # Specify the S3 bucket name and the prefix (directory) where your recordings are stored
bucket_name = 'your-s3-bucket-name'
prefix = 'recordings/' try: response = s3.list_objects_v2(Bucket=bucket_name, Prefix=prefix) # Iterate through the objects and fetch them for obj in response.get('Contents', []): # Get the key (object path) key = obj['Key'] # Download the object to a local file local_filename = key.split('/')[-1] s3.download_file(bucket_name, key, local_filename) print(f"Downloaded {key} to {local_filename}")
except Exception as e: print(f"An error occurred: {e}")
Audio Transcription
Turning spoken words from audio into text is challenging. We use a handy tool called Amazon Web Services (AWS) Transcribe to do this job automatically. But before that, we clean the audio data by removing parts where no one is talking and changing conversations in other languages to English. Also, if there are multiple people talking in a recording, we need to separate their voices and only focus on the one we want to analyze.
However, for the translation part to work, we need our audio recordings in a format that can be accessed through a web link. The code and explanation below will show
you how this all works.
Implementation Code:
transcribe = boto3.client('transcribe', region_name=AWS_REGION_NAME)
def transcribe_audio(audio_uri): job_name_suffix = str(uuid.uuid4()) # Generate a unique job name using timestamp timestamp = str(int(time.time())) transcription_job_name = f'Transcription_{timestamp}_{job_name_suffix}' settings = { 'ShowSpeakerLabels': True, 'MaxSpeakerLabels': 2 } response = transcribe.start_transcription_job( TranscriptionJobName=transcription_job_name, LanguageCode='en-US', Media={'MediaFileUri': audio_uri}, Settings=settings ) transcription_job_name = response['TranscriptionJob']['TranscriptionJobName'] # Wait for the transcription job to complete while True: response = transcribe.get_transcription_job( TranscriptionJobName=transcription_job_name) status = response['TranscriptionJob']['TranscriptionJobStatus'] if status in ['COMPLETED', 'FAILED']: break print("Transcription in progress...") time.sleep(5) transcript_text = None if status == 'COMPLETED': transcript_uri = response['TranscriptionJob']['Transcript']['TranscriptFileUri'] with urllib.request.urlopen(transcript_uri) as url: transcript_json = json.loads(url.read().decode()) transcript_text = transcript_json['results']['transcripts'][0]['transcript'] print("Transcription completed successfully!") print('Transribed Text is:', transcript_text) else: print("Transcription job failed.") # Check if there are any transcripts (if empty, skip sentiment analysis) if not transcript_text: print("Transcript is empty. Skipping sentiment analysis.") return None return transcript_text
Explanation:
Job Initialization: Specify a unique name and language code (in this case, ‘en-US’ for English) to initiate an AWS Transcribe job.
Transcription Settings: We define settings for the transcription job, including options to show speaker labels and specify the maximum number of speaker labels (useful for multi-speaker audio).
Start Transcription: The job will get started using the start_transcription_job method. It asynchronously transcribes the provided audio.
Monitor Job Progress: We periodically check the status of the transcription job. It could be in progress, completed, or failed. We pause and wait for completion before proceeding.
Access Transcription Text: Once the job is completed successfully, we access the transcribed text from the provided transcript URI. This text is then available for sentiment analysis.
Performing Sentiment Analysis
Sentiment analysis is a big deal in our analysis work. It’s all about understanding the feelings and context in the written text that comes from turning audio into words. To handle lots of text, we break it into smaller parts. Then, we use a tool called AWS Comprehend, which is great at figuring out if the text sounds positive, negative, neutral, or if it’s a mix of these feelings.
Implementation Code:
def split_text(text, max_length): # Split the text into chunks of maximum length chunks = [] start = 0 while start < len(text): end = start + max_length chunks.append(text[start:end]) start = end return chunks def perform_sentiment_analysis(transcript): transcript = str(transcript) # Define the maximum length for each chunk max_chunk_length = 5000 # Split the long text into smaller chunks text_chunks = split_text(transcript, max_chunk_length) # Perform sentiment analysis using AWS Comprehend comprehend = boto3.client('comprehend', region_name=AWS_REGION_NAME) sentiment_results = [] confidence_scores = [] # Perform sentiment analysis on each chunk for chunk in text_chunks: response = comprehend.detect_sentiment(Text=chunk, LanguageCode='en') sentiment_results.append(response['Sentiment']) confidence_scores.append(response['SentimentScore']) sentiment_counts = { 'POSITIVE': 0, 'NEGATIVE': 0, 'NEUTRAL': 0, 'MIXED': 0 } # Iterate over sentiment results for each chunk for sentiment in sentiment_results: sentiment_counts[sentiment] += 1 # Determine the majority sentiment aws_sentiment = max(sentiment_counts, key=sentiment_counts.get) # Calculate average confidence scores average_neutral_confidence = round( sum(score['Neutral'] for score in confidence_scores) / len(confidence_scores), 4) average_mixed_confidence = round( sum(score['Mixed'] for score in confidence_scores) / len(confidence_scores), 4) average_positive_confidence = round( sum(score['Positive'] for score in confidence_scores) / len(confidence_scores), 4) average_negative_confidence = round( sum(score['Negative'] for score in confidence_scores) / len(confidence_scores), 4) return { 'aws_sentiment': aws_sentiment, 'average_positive_confidence': average_positive_confidence, 'average_negative_confidence': average_negative_confidence, 'average_neutral_confidence': average_neutral_confidence, 'average_mixed_confidence': average_mixed_confidence }Explanation:
Breaking Down the Text: To handle a lot of text more easily, we split the transcript into smaller parts that we can manage better. We will then look into these smaller parts one by one.
Understanding Emotions: We use AWS Comprehend to figure out the emotions (like positive, negative, neutral, mixed) in each of these smaller parts. It also tells us how sure it is about these emotions.
Keeping Count of Emotions: We note down how many times each emotion comes up in all these smaller parts. This helps us know what most people are feeling overall.
Finding Confidence: We calculate an average score for how sure AWS Comprehend is about the emotions it finds. This helps us see how confident the system is in its results.
Calculating Sentiment Metrics
After performing sentiment analysis on individual chunks of text, we proceed to calculate meaningful sentiment metrics. These metrics provide insights into the overall sentiment and customer or employee perception.
Implementation Code:
result = perform_sentiment_analysis(transcript)
def sentiment_metrics(result): # Initialize variables to store cumulative scores total_sentiment_value = '' total_positive_score = 0 total_negative_score = 0 total_neutral_score = 0 total_mixed_score = 0 # Counters for each sentiment category count_positive = 0 count_negative = 0 count_neutral = 0 count_mixed = 0 # Process the fetched data and calculate metrics for record in result: sentiment_value = aws_sentiment positive_score = average_positive_confidence negative_score = average_negative_confidence neutral_score = average_neutral_confidence mixed_score = average_mixed_confidence # Count occurrences of each sentiment category if sentiment_value == 'POSITIVE': count_positive += 1 elif sentiment_value == 'NEGATIVE': count_negative += 1 elif sentiment_value == 'NEUTRAL': count_neutral += 1 elif sentiment_value == 'MIXED': count_mixed += 1 # Calculate cumulative scores total_sentiment_value = max(sentiment_value) total_positive_score += positive_score total_negative_score += negative_score total_neutral_score += neutral_score total_mixed_score += mixed_score # Calculate averages total_records = len(result) overall_sentiment = total_sentiment_value average_positive = total_positive_score / total_records if total_records > 0 else 0 average_negative = total_negative_score / total_records if total_records > 0 else 0 average_neutral = total_neutral_score / total_records if total_records > 0 else 0 average_mixed = total_mixed_score / total_records if total_records > 0 else 0 # Calculate NPS only if there are records if total_records > 0: NPS = ((count_positive/total_records) - (count_negative/total_records)) * 100 NPS_formatted = "{:.2f}%".format(NPS) else: NPS_formatted = "N/A" # Create a dictionary to store the calculated metrics metrics = { "total_records": total_records, "overall_sentiment": overall_sentiment, "average_positive": average_positive, "average_negative": average_negative, "average_neutral": average_neutral, "average_mixed": average_mixed, "count_positive": count_positive, "count_negative": count_negative, "count_neutral": count_neutral, "count_mixed": count_mixed, "NPS": NPS_formatted } return metrics
Explanation:
Cumulative Scores: We start by setting up some variables to keep track of the total scores for positive, negative, neutral, and mixed feelings. These scores will add up as we go through all the analyzed parts.
Counting Sentiments: We keep counting how many times each type of emotion shows up, just like we did when we were figuring out the feelings earlier.
Finding Averages: We figure out the average scores for emotions and the overall mood based on what most people seem to be feeling. We also calculate something called the Net Promoter Score (NPS) using a special formula we mentioned earlier.
Creating Trend Charts
To see how emotions change over time, we create trend charts. These are like pictures that visually represent whether emotions are increasing or decreasing. They help companies identify any patterns and use this information to make smart decisions based on data.
Procedure:
Data Aggregation: We calculate the average sentiment scores and NPS values for each week. These values are saved in dictionary format and will be used to create trend charts.
Calculating Week Number: For each audio recording, we determine the week in which it occurred. This is important for organizing data into weekly trends.
Calculating Averages: We calculate the average sentiment scores and NPS values for each week. These values will be used to create trend charts.
Result of the Sentiment Analysis
After the analysis, we can create the result page, as shown below. This page gives the overall report, like the total number of recordings, total call duration, etc. Also, it displays charts representing the average scores and trends. We can also capture negative scores and their details separately.
Conclusion
In today’s fast-paced business world, understanding what customers feel is crucial. It’s like having a secret tool to make customers happier. Sentiment analysis of audio call recordings helps to gain insights into customer interactions. This article explained the steps of conducting sentiment analysis, from turning audio into text to creating trend charts.
First, we used tools like AWS Transcribe to help us convert spoken words from these audio transcriptions into readable text. The sentiment analysis then assessed the emotions and context and categorized them as positive, negative, neutral, or mixed sentiments.
The sentiment metrics involved aggregating scores and calculating the Net Promoter Score (NPS), which could then be plotted on charts and graphs to identify issues, monitor progress, and improve loyalty.
Key Takeaways
- Sentiment analysis is a powerful tool for businesses to understand feedback, make improvements, and deliver customer experiences.
- Sentiment changes over time can be visualized by trend charts, helping organizations make data-driven decisions.
Frequently Asked Questions
Ans. Sentiment analysis determines the emotional tone and context of text data using the NLP technique. In customer care, this type of analysis helps organizations understand how customers feel about their products or services. It’s crucial because it provides actionable insights into customer satisfaction and enables businesses to improve their services based on customer feedback. It helps to see how employees are interacting with customers.
Ans. Audio transcription is the process of converting spoken words in audio into written text. In sentiment analysis, it’s the first thing we do. We use tools like AWS Transcribe to change what people say in a call into words a computer can understand. After that, we can look at the words to see how people feel.
Ans. Sentiments are usually categorized into four main categories: Positive, Negative, Neutral, and Mixed. “Positive” indicates a positive sentiment or satisfaction. “Negative” reflects dissatisfaction or a negative sentiment. “Neutral” says lack of positive and negative sentiment, and “Mixed” means mixing up positive and negative emotions in the text.
Ans. NPS is a number that tells us how much people like a company or service. We find it by taking the percentage of people who like it (positive) and subtracting the percentage of people who don’t like it (negative). The formula looks like this: NPS = ((Positive People / Total People) – (Negative People / Total People)) * 100. A higher NPS means more happy customers.
Ans. Trend charts are like pictures that show how people’s feelings change over time. They help companies see if customers are getting happier or sadder. Companies can use trend charts to find patterns and see whether their improvements work. Trend charts help companies make smart choices and can check their changes to make customers happy.
The media shown in this article is not owned by Analytics Vidhya and is used at the Author’s discretion.
Related
- SEO Powered Content & PR Distribution. Get Amplified Today.
- PlatoData.Network Vertical Generative Ai. Empower Yourself. Access Here.
- PlatoAiStream. Web3 Intelligence. Knowledge Amplified. Access Here.
- PlatoESG. Carbon, CleanTech, Energy, Environment, Solar, Waste Management. Access Here.
- PlatoHealth. Biotech and Clinical Trials Intelligence. Access Here.
- Source: https://www.analyticsvidhya.com/blog/2023/09/decoding-customer-care-sentiments-comprehensive-audio-analysis-guide/
- :is
- :not
- :where
- $UP
- 1
- 10
- 100
- 11
- 12
- 14
- 5000
- a
- About
- above
- access
- accessed
- accessible
- achieved
- achieving
- acts
- add
- After
- aggregation
- All
- also
- Amazon
- Amazon Web Services
- Amazon Web Services (AWS)
- an
- analysis
- analytics
- Analytics Vidhya
- analyze
- analyzed
- analyzing
- and
- any
- appealing
- Application
- ARE
- article
- AS
- asked
- assessed
- At
- audio
- automatically
- available
- average
- AWS
- based
- BE
- because
- before
- begin
- Beginning
- below
- benefits
- Better
- Big
- blogathon
- both
- Break
- build
- Building
- business
- businesses
- but
- by
- calculate
- calculated
- calculating
- calculations
- call
- called
- Calls
- CAN
- capture
- captured
- care
- case
- categories
- Category
- certain
- challenging
- change
- Changes
- changing
- Charts
- check
- choices
- client
- code
- comes
- Companies
- company
- complete
- Completed
- completion
- complexities
- comprehend
- comprehensive
- computer
- conducting
- confidence
- confident
- contents
- context
- conversations
- convert
- converting
- could
- counters
- counting
- cover
- create
- created
- Creating
- critical
- crucial
- CSS
- customer
- Customer satisfaction
- Customers
- customize
- data
- data science
- data-driven
- Database
- Date
- Dates
- datetime
- deal
- decisions
- Decoding
- define
- deliver
- detailed
- details
- Determine
- determines
- DID
- discretion
- displays
- divide
- do
- does
- Dont
- down
- download
- duration
- during
- e
- each
- Earlier
- easily
- easy
- else
- emotion
- emotional
- emotions
- Employee
- employees
- empty
- enables
- end
- English
- enhance
- ensuring
- error
- especially
- essential
- etc
- Ether (ETH)
- example
- Except
- exception
- Experiences
- explained
- explanation
- explore
- explores
- expressed
- extract
- Failed
- fast-paced
- feedback
- feel
- feelings
- Fetched
- Figure
- File
- final
- Find
- finds
- First
- Focus
- follow
- following
- follows
- For
- form
- format
- formula
- Foundation
- four
- from
- fundamental
- Gain
- gather
- generate
- get
- getting
- given
- gives
- Go
- goal
- graphs
- great
- guidance
- guide
- handle
- handy
- happier
- happy
- Have
- having
- Heart
- help
- helping
- helps
- higher
- How
- How To
- HTML
- HTTPS
- identify
- if
- implementation
- import
- important
- improve
- improvements
- in
- In other
- Including
- increasing
- indicates
- individual
- information
- initiate
- inputs
- insights
- instead
- interact
- interacting
- interactions
- Interface
- into
- involved
- issues
- IT
- ITS
- JavaScript
- Job
- json
- just
- Keep
- Key
- Know
- Labels
- Lack
- language
- Languages
- large
- Length
- libraries
- lies
- like
- LINK
- local
- location
- locations
- Long
- Look
- LOOKS
- Lot
- lots
- Loyalty
- Main
- Majority
- make
- manage
- manageable
- many
- maximum
- meaningful
- means
- Media
- mentioned
- method
- metric
- Metrics
- mix
- mixed
- Mixing
- Monitor
- mood
- more
- most
- much
- multiple
- must
- name
- names
- necessary
- Need
- negative
- negatives
- net
- Neutral
- next
- nlp
- no
- None
- note
- number
- object
- objects
- occurred
- of
- offer
- on
- once
- ONE
- only
- Options
- or
- organizations
- organizing
- OS
- Other
- our
- out
- over
- overall
- owned
- page
- part
- parts
- path
- patterns
- pause
- People
- people’s
- percentage
- perception
- perform
- performing
- period
- phase
- Pictures
- plato
- Plato Data Intelligence
- PlatoData
- plays
- positive
- Post
- powerful
- preparing
- present
- procedure
- proceed
- process
- Products
- Progress
- project
- provide
- provided
- provides
- providing
- published
- Python
- quality
- quantifies
- RE
- record
- recording
- records
- reflects
- removing
- report
- represent
- representing
- request
- requests
- required
- response
- result
- Results
- return
- right
- roadmap
- Role
- satisfaction
- saved
- say
- says
- Science
- score
- scores
- Secret
- Section
- see
- seem
- selected
- sentiment
- sentiments
- separate
- separately
- service
- Services
- setting
- settings
- should
- show
- shown
- Shows
- single
- smaller
- smart
- some
- something
- Speaker
- special
- specific
- split
- spoken
- start
- started
- Starting
- Status
- Step
- Steps
- store
- stored
- Study
- Successfully
- such
- sure
- system
- taking
- talking
- Task
- tasks
- tells
- text
- that
- The
- their
- Them
- then
- There.
- These
- they
- thing
- this
- Through
- time
- times
- timestamp
- to
- today’s
- TONE
- tool
- tools
- Total
- track
- Transcript
- Translation
- Trend
- Trends
- true
- try
- Turning
- type
- typically
- understand
- understanding
- unique
- uploaded
- URI
- URL
- us
- use
- used
- useful
- User
- User Interface
- user-friendly
- users
- uses
- using
- usually
- Values
- variables
- various
- very
- visually
- VOICES
- volumes
- wait
- want
- was
- we
- web
- Web application
- web services
- webp
- week
- weekly
- were
- What
- What is
- when
- whether
- which
- while
- WHO
- why
- will
- with
- within
- words
- Work
- works
- world
- written
- you
- Your
- zephyrnet