SNEAK PEEK
- FLR market sees a strong bullish trend with the potential for continued price increases.
- Investors show increased interest and confidence in the FLR market.
- Traders may consider buying opportunities as momentum and bullish trends prevail.
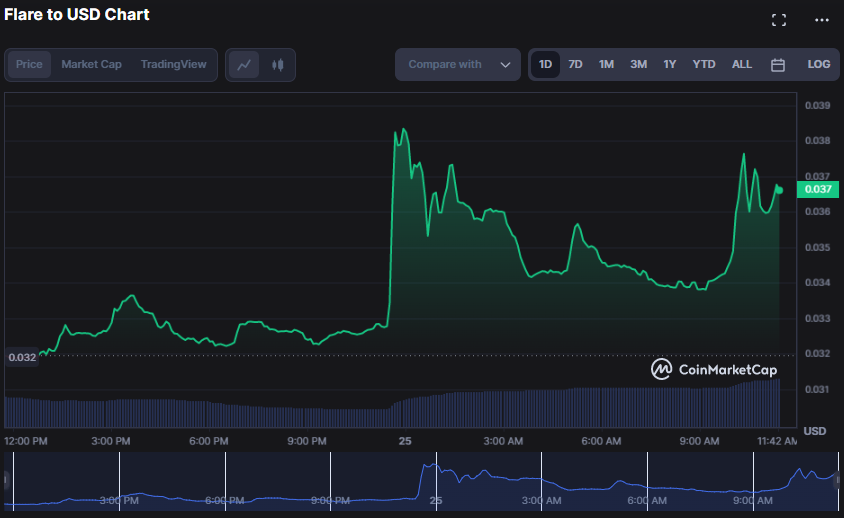
Bulls have dominated the Flare market (FLR) over the past 24 hours, driving prices from intraday lows of $0.03185 to highs of $0.03835. The market may soon continue to rise due to this surge, indicating that investors strongly prefer buying.
The price has increased by 7.32% to $0.0343 as of press time due to the ongoing bullish trend; as a result, investors are more optimistic about the stock’s future performance and are willing to pay a higher price for it.
The market capitalization and 24-hour trading volume grew by 7.33% and 14.39%, to $409,428,085 and $24,567,243, respectively. This jump indicates that investors have raised their interest and confidence in the asset, perhaps predicting a positive trend in the near future. Nevertheless, since market movements are unexpected and may occur quickly, investors should continue actively watching the market and making informed decisions based on their specific investment objectives and risk tolerance.
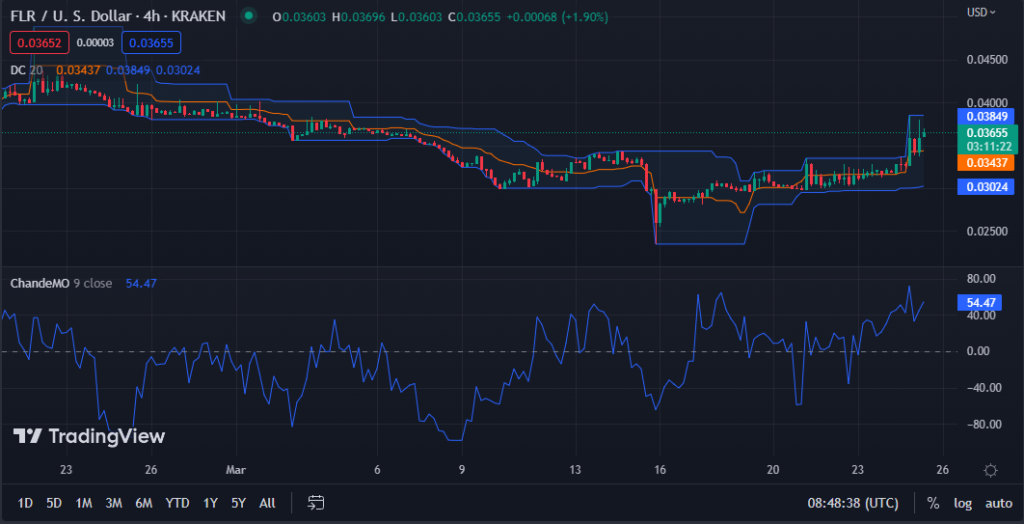
On the Flare market’s 4-hour price chart, the Donchian Channels (DC) up and down readings are 0.03849 and 0.03011, respectively. This move demonstrates that there has been relatively little volatility in the Flare market over the last four hours, with the price remaining within a small range between the higher and lower limits of the DC.
The Chande Momentum Oscillator (ChandeMo) has its line facing North with a positive value of 51.84 on the 4-hour price chart of the Flare market. This demonstrates that the market is experiencing strong momentum and a bullish trend, suggesting that buyers are in charge and that prices may rise in the near future.
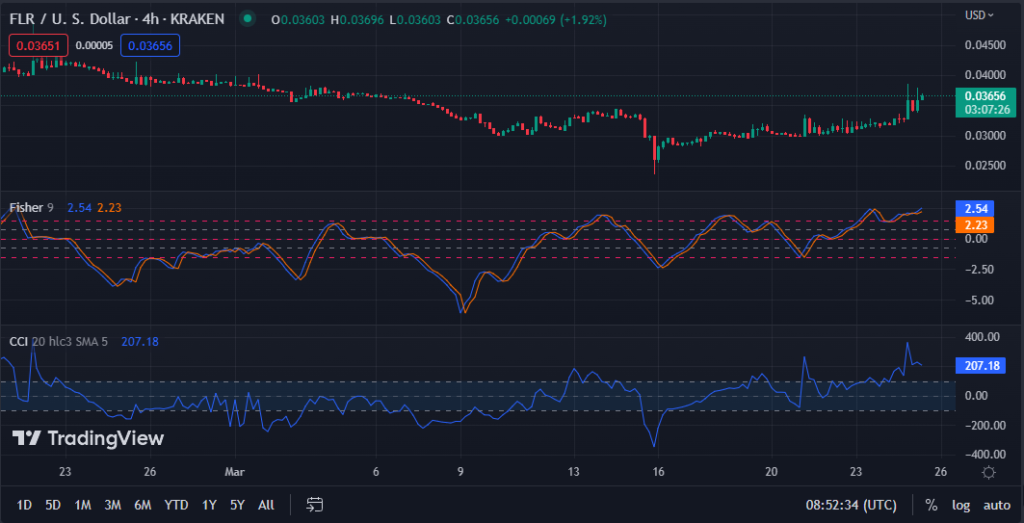
Both lines of the Fisher Transform indicator (Fisher) face north, with upward and downward readings of 2.23 and 2.05, respectively. This motion suggests a solid bullish trend currently prevailing in the market, and traders may look for opportunities to buy. Given the significant upward momentum in the market and the 0.18 difference between the two lines, there is a strong likelihood that price increases will continue in the near term.
With a value of 251.07, the Commodity Channel Index (CCI) is positive, with its line pointing north. This shows that the asset’s current price is significantly higher than its average price, which may indicate an overbought condition.
Investors are bullish on FLR as prices surge, market cap grows, and technical indicators signal momentum. Caution is advised due to potential market unpredictability.
Disclaimer: Cryptocurrency price is highly speculative and volatile and should not be considered financial advice. Past and current performance is not indicative of future results. Always research and consult with a financial advisor before making investment decisions.
- SEO Powered Content & PR Distribution. Get Amplified Today.
- Platoblockchain. Web3 Metaverse Intelligence. Knowledge Amplified. Access Here.
- Source: https://investorbites.com/flare-price-analysis-25-3/
- :is
- $UP
- 7
- 84
- a
- About
- actively
- advice
- advisor
- always
- analysis
- and
- ARE
- AS
- asset
- average
- based
- BE
- before
- between
- Bullish
- Bulls
- buy
- buyers
- Buying
- by
- cap
- capitalization
- Channel
- channels
- charge
- Chart
- CoinMarketCap
- commodity
- condition
- confidence
- Consider
- considered
- continue
- continued
- Current
- Currently
- dc
- decisions
- demonstrates
- difference
- down
- downward
- driving
- experiencing
- Face
- facing
- financial
- financial advice
- flare
- FLR
- For
- from
- future
- given
- Grows
- Have
- higher
- highly
- Highs
- HOURS
- HTTPS
- in
- increased
- Increases
- index
- indicate
- indicates
- Indicator
- Indicators
- informed
- interest
- internal
- investment
- Investors
- IT
- ITS
- jump
- Last
- limits
- Line
- lines
- little
- Look
- Lows
- Making
- Market
- Market Cap
- Market Capitalization
- market confidence
- Market News
- max-width
- Momentum
- more
- motion
- move
- movements
- Near
- Nevertheless
- news
- North
- objectives
- of
- on
- ongoing
- opportunities
- Optimistic
- past
- Pay
- performance
- perhaps
- plato
- Plato Data Intelligence
- PlatoData
- positive
- potential
- predicting
- prefer
- press
- price
- Price Analysis
- price chart
- Prices
- quickly
- raised
- range
- relatively
- remaining
- research
- result
- Results
- Rise
- Risk
- Roll
- sees
- should
- show
- Shows
- Signal
- significant
- significantly
- since
- small
- solid
- Soon
- Source
- specific
- strong
- strongly
- Suggests
- surge
- Technical
- that
- The
- their
- time
- to
- tolerance
- Traders
- Trading
- trading volume
- TradingView
- Transform
- Trend
- Trends
- Unexpected
- upward
- upward momentum
- value
- volatile
- Volatility
- volume
- watching
- which
- will
- willing
- with
- within
- zephyrnet