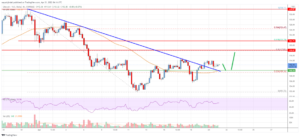
- Litecoin failed to clear the $145 resistance and corrected lower against the US Dollar.
- LTC price is now trading below $132 and the 55 simple moving average (4-hours).
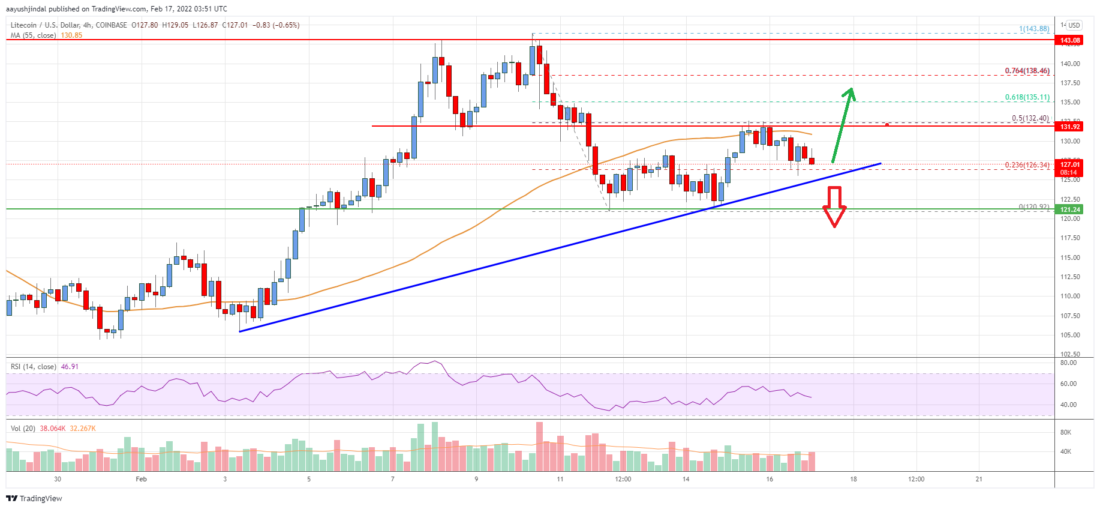
- There is a key bullish trend line forming with support near $125 on the 4-hours chart of the LTC/USD pair (data feed from Coinbase).
- The pair could continue to rise if it stays above the $125 and $120 support levels.
Litecoin price is struggling below $132 against the US Dollar, similar to bitcoin. LTC price could resume higher if it stays above the $120 support zone.
Litecoin Price Analysis
This week, there was a decent increase in bitcoin, ethereum, ripple, and litecoin against the US Dollar. Earlier, LTC formed a base above the $120 level and started a fresh increase.
There was a move above the $122 and $125 resistance levels. The price surpassed the 23.6% Fib retracement level of the recent decline from the $144 swing high to $121 swing low. The price spiked above $130, but it faced sellers near the $132 level.
There was a rejection near the 50% Fib retracement level of the recent decline from the $144 swing high to $121 swing low. It is now trading below $132 and the 55 simple moving average (4-hours).
On the downside, an immediate support is near the $125 level. There is also a key bullish trend line forming with support near $125 on the 4-hours chart of the LTC/USD pair. The next key support is near the $120 level.
If there is a downside break below the $120 support, the price could continue to move down towards the $105 level. On the upside, litecoin is facing resistance near the $130 level. The next major resistance for the bulls is near the $132 level.
To start a fresh increase, the price must clear $132. In the stated case, the price could rise towards $145. The next key resistance could be $150.

Litecoin (LTC) Price
Looking at the chart, litecoin price is clearly trading below $132 and the 55 simple moving average (4-hours). Overall, the price could continue to rise if it stays above the $125 and $120 support levels.
Technical indicators
4 hours MACD – The MACD for LTC/USD is slowly losing pace in the bearish zone.
4 hours RSI (Relative Strength Index) – The RSI for LTC/USD is now below the 50 level.
Key Support Levels – $125 and $120
Key Resistance Levels – $132 and $145.
The post Litecoin (LTC) Price Analysis: Key Breakout Zone At $132 appeared first on Live Bitcoin News.
- analysis
- average
- bearish
- Bitcoin
- breakout
- Bullish
- Bulls
- coinbase
- comments
- continue
- could
- data
- Dollar
- down
- faced
- facing
- fresh
- High
- HTTPS
- Increase
- index
- IT
- Key
- Level
- levels
- Line
- Litecoin
- Litecoin (LTC)
- Litecoin price
- LTC
- ltc price
- LTC/USD
- MACD
- major
- move
- Near
- price
- Price Analysis
- Sellers
- similar
- Simple
- start
- started
- support
- Trading
- us
- US Dollar
- week