Materials
MMT (BYK Additives Incorporation; Cloisite Na+), northern bleached softwood kraft (NBSK) pulp (NIST RM 8495), TEMPO (Sigma-Aldrich, 99%), sodium bromide (NaBr, Sigma-Aldrich, ACS reagent, ≥99.0%), sodium hypochlorite solution (NaClO, Sigma-Aldrich, reagent grade, available chlorine 10–15%), sodium hydroxide (NaOH, Sigma-Aldrich, reagent grade, ≥98%), gelatin (Sigma-Aldrich, from cold-water fish skin) and glycerol (Sigma-Aldrich, ACS reagent, ≥99.5%) were used as received without further purification. Deionized (DI) water (18.2 MΩ) was obtained from a Milli-Q water purification system (Millipore) and used as the water source throughout this work.
Preparation of MMT nanosheet dispersion
The MMT nanosheet dispersion was prepared according to the literature57. To obtain medium-sized MMT nanosheets, MMT powders were mixed in DI water at 10 mg ml−1, and the mixture was ultrasonicated for 2 h and continuously stirred for another 12 h. Afterward, the mixture was centrifuged at 1,252g for 60 min, and the supernatant was then collected as the dispersion of MMT nanosheets with the concentration about 8 mg ml−1. To obtain small-sized MMT nanosheets, the ultrasonication time was extended to 3 h, and the mixture was centrifuged at 5,009g for 60 min. Conversely, for large-sized MMT nanosheets, the ultrasonication time was reduced to 1 h, and the mixture was centrifuged at a slower speed of 489g for 15 min.
Preparation of CNF dispersion
The CNF dispersion was prepared according to the literature58. First, 20 g of NBSK pulp was suspended in 1.0 litre of DI water, and then TEMPO (2 × 10⁻³ mol) and NaBr (0.02 mol) were added into the pulp. The TEMPO-mediated oxidation was initiated by adding 0.2 mol of NaClO, and the oxidation process was maintained under continuous stirring for 5–6 h, during which the pH was controlled at 10.0 by adding NaOH solution (3.0 M). The TEMPO-oxidized pulp was repeatedly washed with DI water until the pH returned back to 7.0. Afterward, the pulp was disassembled in a microfluidizer processor (Microfluidics M-110EH), and the concentration of CNF dispersion was about 10 mg ml−1.
Preparation of gelatin solution
A total of 8.0 g of gelatin was dissolved in 1.0 litre of DI water followed by continuous stirring for 48 h, and the concentration of gelatin solution was 8.0 mg ml−1.
Preparation of glycerol solution
A total of 8.4 g of glycerol was dissolved in 1.0 litre of DI water followed by continuous stirring for 12 h, and the concentration of glycerol solution was 8.4 mg ml−1.
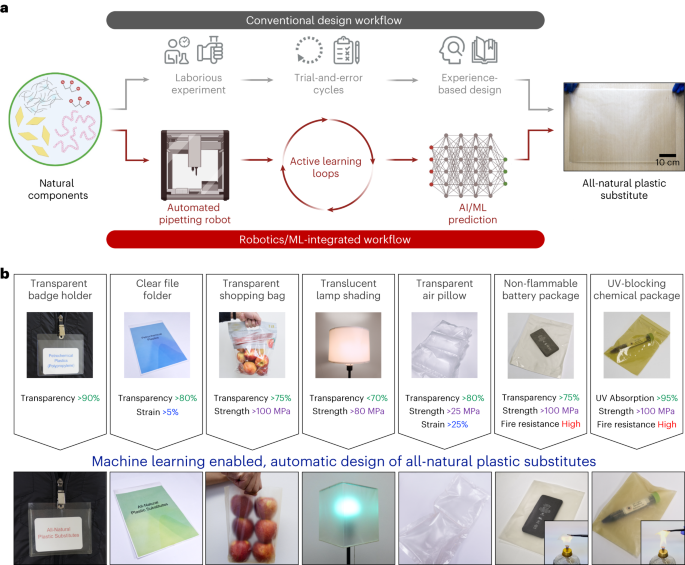
Fabrication of all-natural nanocomposite films via an automated pipetting robot
An automated pipetting robot (Opentrons OT-2) was operated to prepare different mixtures with varying MMT/CNF/gelatin/glycerol ratios. For each mixture, the dispersions/solutions of MMT nanosheets, CNFs, gelatin and glycerol were mixed at different volumes. Afterward, the robot-prepared mixtures were vortexed at 3,000 rpm for 30 s and placed in a vacuum desiccator to remove air bubbles. Then, the mixtures were cast into a flat, polystyrene-based container at 40 °C and air dried for 48 h.
Identification of A-grade nanocomposites
Each nanocomposite film was subject to detachment and flatness testing after it dried. Regarding detachability, except for samples that can be clearly labelled as detachable or non-detachable (Supplementary Fig. 38a), the mechanical delamination tests were conducted to measure the binding energies of nanocomposite films on hydrophobic polystyrene substrates. As shown in Supplementary Fig. 39. all the detachable samples exhibited the binding energies of <0.4 J cm−2, while the undetachable ones were with the binding energies >0.6 J cm−2. Thus, the threshold binding energy was set to be 0.5 J cm−2 to classify the detachability of nanocomposite films. Regarding flatness, except for samples that can be clearly labelled as flat or curved (Supplementary Fig. 38b), a high-speed laser scanning confocal microscope was employed to characterize the roughness of nanocomposite films. As demonstrated in Supplementary Fig. 40a, the nanocomposite films considered ‘flat’ exhibited height differences of <200 µm. Meanwhile, those considered ‘curved’ typically showcased height differences of >500 µm (Supplementary Fig. 40b). Once the detachment and flatness tests were finished, only the detachable and flat samples were identified as A-grade nanocomposites.
Determination of SVM classifier accuracy
After constructing the SVM classifier, we examined its prediction accuracy using a set of testing data points. As shown in Supplementary Table 3, a total of 35 MMT/CNF/gelatin/glycerol ratios were randomly selected, and 35 nanocomposite films were fabricated according to the established procedure. Detachment and flatness tests were conducted to categorize these nanocomposite films into different grades. Subsequently, the MMT/CNF/gelatin/glycerol ratios (that is, composition labels) were input into the SVM classifier to obtain the predicted grades, which were then compared with the experimental results. In this study, the SVM classifier accurately predicted the grades for 33 out of the 35 nanocomposite films, resulting in a prediction accuracy of 94.3%.
Determination of ANN-based prediction model accuracy
After constructing the ANN-based prediction model, we examined its prediction accuracy using a set of testing data points.
The deviation between model-predicted property labels and actual property values was quantified using a MRE, defined in equation (3),
$${rm{MRE}}=frac{1}{N},mathop{sum }limits_{i=1}^{N}left|frac{{{{mathrm{output}}}}^{i}-{E}^{i}}{{E}^{i}}right|,$$
(3)
where N is the cumulative number of testing data, ({{{mathrm{output}}}}^{i}) is the model-predicted property labels based on a testing datum (i), ({E}^{i}) is the actual property values of a testing datum (i). A smaller MRE value indicates higher prediction accuracy and vice versa.
Film thickness characterization
The thickness of each all-natural nanocomposite was initially determined using a digital micrometre (293-340-30, Mitutoyo). For each strip sample used in the mechanical test, the nanocomposite thickness was gauged at three separate points, and the average thickness value was derived. Furthermore, the thickness of the all-natural nanocomposites was verified using a field emission scanning electron microscope (Tecan XEIA) operating at 15.0 kV. Cross-sectional SEM images were taken, followed by thickness measurements to validate the earlier readings.
Transmittance spectrum characterization
The transmittance spectra of all-natural nanocomposites were measured with an ultraviolet (UV)–visible spectrometer from 250 to 1,100 nm (UV-3600 Plus, PerkinElmer) equipped with an integrating sphere. The transmittance values at 365, 550 and 950 nm were extracted as the ‘spectral’ labels (({T}_{{{mathrm{UV}}}}), ({T}_{{{mathrm{Vis}}}}) and ({T}_{{{mathrm{IR}}}})), respectively.
Fire resistance characterization
The fire resistances of the all-natural nanocomposites were assessed using a horizontal combustibility testing method, modified from the standard test method (ASTM D6413)59. The all-natural nanocomposites were cut into 1 cm × 1 cm squares, and then they were exposed to the flame of an ethanol burner for 30 s (with a flame temperature ranging from 600 °C o 850 °C)60. The fire resistance of the all-natural nanocomposites was quantified in terms of ({{mathrm{RR}}}). Three replicates were conducted, and the average ({{mathrm{RR}}}) values were recorded as the fire labels.
Mechanical property characterization
The stress–strain curves of the all-natural nanocomposites were determined using a mechanical testing machine (Instron 68SC-05) fitted with a 500-N load cell. After calibrating the load cell, the all-natural nanocomposites were cut into 3 cm × 1 cm stripes and subject to a tensile test at an extension rate of 0.02 mm s−1. The tensile tests started with an initial fixture gap of 2 cm. Three replicates were conducted for each all-natural nanocomposites.
Materials characterization
The surface functional groups of all-natural nanocomposites were characterized using a Fourier transform infrared spectroscopy (FT-IR, Thermo Nicolet NEXUS 670).
Biocompatibility tests of all-natural nanocomposites
The cytotoxic effects of all-natural nanocomposites on the cultured cells (that is, L929 cells) were determined by complying with ISO 10993. Six all-natural nanocomposites with different MMT/CNF/gelatin/glycerol ratios were incubated with Dulbecco’s modified Eagle medium (DMEM, Gibco) supplemented with foetal bovine serum (Biological Industries) at 37 °C for 24 h, and the media were then extracted for cell culture. L929 cells were then seeded in 96-well cell culture plates at the density of 1 × 10⁴ cells per well and incubated in a standard cell incubation environment with 5% CO2. After 24 h of cell culture, the culture media were removed and replaced with the extracts of all-natural nanocomposites followed by additional 24-h incubation. After 24 h, the culture media were withdrawn, and 3-(4,5-dimethylthiazol-2-yl)-2,5-diphenyltetrazolium bromide solution was added to each well. Then, the cell culture plate was incubated for 2 h at 37 °C. After the 3-(4,5-dimethylthiazol-2-yl)-2,5-diphenyltetrazolium bromide solution was discarded, 200 ml of dimethyl sulfoxide was added to dissolve the formazan crystals. The optical density of the formazan solution was read by an enzyme-linked immunosorbent assay plate reader at 570 nm with a reference wavelength of 650 nm.
The cytotoxicity of all-natural nanocomposites was evaluated by a cytotoxicity detection kit (Roche). First, the L929 cells were incubated with the all-natural nanocomposite extracts at 37 °C for 24 h, and the medium (100 µl) was collected and incubated with the reaction mixture from the kit following the manufacturer’s instructions. LDH content was assessed by enzyme-linked immunosorbent assay and read at an absorbance of 490 nm in a plate reader with a reference wavelength of 630 nm. To further confirm the cytotoxicity of all-natural nanocomposites, a fluorescence-based live/dead assay (LIVE/DEAD kit, Life) was performed. After the L929 cells were cultured with the extracts for 24 h, calcein was mixed with ethidium homodimer-1 according to the manufacturer’s instructions, and the dye (100 µl) was mixed with the retained medium (100 µl), which was added to each well and incubated at 37 °C for 15 min. After the incubation, we used an inverted microscope (Leica DMi8) to capture the images of live (green) and dead (red) cells. Fluorescence with excitation wavelengths of 488 nm and 561 nm was used to visualize the green (515 nm) and red (635 nm) fluorescence signals emitted by calcein and ethidium homodimer-1, respectively. ImageJ software was employed to calculate the proportion of live and dead cell areas. The relative percentages of fluorescence intensity were also determined. ImageJ was utilized to quantify the areas of red and green fluorescence, which produced average values. These numerical values were subsequently used in the quantification formula to determine the fluorescence intensity of live/dead cells in equation (4):
$${rm{Fluorescence}},{rm{intensity}}=({rm{Live}}/{rm{Dead}})/({rm{Live}}+{rm{Dead}})times 100 %$$
(4)
MD simulations
The full atomistic simulations utilized the ReaxFF potential within the Large-scale Atomic/Molecular Massively Parallel Simulator (LAMMPS) simulation package61. The ReaxFF potential is widely used to describe chemical bonds and weak interactions of cellulose chains and MMT nanosheets62,63. As shown in Supplementary Fig. 41a, the MD model of the MMT/CNF nanocomposite configured as a multilayered microstructure comprising alternating CNF chains and MMT nanosheets, similar to the SEM observations in Supplementary Fig. 41b. The length of the cellulose chains was set to 104 Å, and the scale of the MMT nanosheets was randomly set between 30 Å and 60 Å, corresponding to the length scale ratio in the experiments (LCNF:LMMT = 1:2). The cellulose chains and MMT nanosheets were passivated by polar hydrogens or –OH groups. The entire system was equilibrated under the isothermal-isobaric ensemble (that is, NPT ensemble) at 300 K and 0 atm, using the Nosé–Hoover thermostat and barostat. Then, the micro-canonical ensemble was applied in the stretching process. The timestep was set as 0.5 fs, and the periodic boundary conditions were applied in all directions (x, y and z) for all models. To better understand intermolecular interactions, both cellulose chains and MMT nanosheets were randomly arranged in alignment in the periodical box. All calculations were relaxed using the conjugate gradient algorithm to minimize the total energy of the system until the total atomic forces were converged to less than 10–9 eV Å–1.
- SEO Powered Content & PR Distribution. Get Amplified Today.
- PlatoData.Network Vertical Generative Ai. Empower Yourself. Access Here.
- PlatoAiStream. Web3 Intelligence. Knowledge Amplified. Access Here.
- PlatoESG. Carbon, CleanTech, Energy, Environment, Solar, Waste Management. Access Here.
- PlatoHealth. Biotech and Clinical Trials Intelligence. Access Here.
- Source: https://www.nature.com/articles/s41565-024-01635-z
- :is
- ][p
- 000
- 02
- 1
- 10
- 100
- 12
- 14
- 15%
- 1995
- 2%
- 20
- 200
- 2011
- 2015
- 2018
- 2020
- 24
- 25
- 250
- 30
- 300
- 33
- 34
- 35%
- 4
- 40
- 48
- 5
- 500
- 515
- 58
- 6
- 60
- 62
- 7
- 8
- a
- About
- acceleration
- According
- accuracy
- accurately
- actual
- added
- adding
- Additional
- additives
- After
- AIR
- AL
- algorithm
- algorithms
- alignment
- All
- also
- an
- Anchor
- and
- Another
- applied
- areas
- arranged
- AS
- assessed
- At
- ATM
- Automated
- autonomous
- available
- average
- back
- based
- BE
- Better
- between
- binding
- Bonds
- both
- Box
- by
- calculate
- calculations
- CAN
- capture
- categorize
- cell
- Cells
- chains
- chang
- characterize
- characterized
- chemical
- chen
- classifier
- Classify
- clearly
- click
- collected
- compared
- complying
- composition
- comprising
- concentration
- conditions
- conducted
- configured
- Confirm
- conjugate
- considered
- constructing
- Container
- content
- continuous
- continuously
- controlled
- conversely
- Corresponding
- Culture
- curves
- Cut
- cytotoxic
- cytotoxicity
- data
- data points
- dead
- defined
- demonstrated
- density
- Derived
- describe
- Detection
- Determine
- determined
- deviation
- differences
- different
- digital
- directions
- discarded
- discovery
- Dispersion
- during
- dynamics
- e
- E&T
- each
- eagle
- Earlier
- effects
- emission
- employed
- energy
- engineered
- Entire
- Environment
- equation
- equipped
- established
- Ether (ETH)
- EV
- evaluated
- Except
- exhibited
- expansion
- expansive
- experimental
- experiments
- exposed
- extended
- extension
- Extracts
- FAST
- field
- Fig
- Film
- films
- finished
- Fire
- First
- Fish
- flat
- followed
- following
- For
- Forces
- formation
- formula
- fourier
- from
- FS
- full
- functional
- further
- Furthermore
- gap
- grade
- Green
- Group’s
- height
- higher
- Horizontal
- HTTPS
- Hybrid
- hydration
- identified
- images
- in
- incubated
- INCUBATION
- indicates
- industries
- initial
- initially
- initiated
- input
- instructions
- Integrating
- interactions
- into
- ISO
- IT
- ITS
- kit
- Labels
- large-scale
- laser
- Length
- less
- Life
- lin
- LINK
- live
- load
- machine
- maintained
- massively
- material
- materials
- Meanwhile
- measure
- measured
- measurements
- mechanical
- mechanism
- Media
- medium
- method
- Microscope
- min
- minimize
- mixed
- mixture
- ML
- model
- models
- modified
- MOL
- molecular
- MultiLayered
- nanotechnology
- Natural
- Nature
- nexus
- nist
- number
- numerical
- observations
- obtain
- obtained
- of
- on
- once
- ones
- only
- operated
- operating
- optical
- or
- out
- Parallel
- per
- percentages
- performed
- periodic
- placed
- plastic
- Platforms
- plato
- Plato Data Intelligence
- PlatoData
- plus
- points
- polar
- potential
- predicted
- prediction
- Prepare
- prepared
- procedure
- process
- Processor
- Produced
- property
- proportion
- quantification
- quantified
- ranging
- Rate
- ratio
- ratios
- reaction
- Read
- Reader
- received
- recorded
- Red
- Reduced
- reference
- regarding
- Relationships
- relative
- relaxed
- remove
- Removed
- ren
- REPEATEDLY
- replaced
- replicates
- Resistance
- resulting
- Results
- revealing
- robot
- roche
- s
- sample
- Scale
- scanning
- selected
- SEM
- separate
- Serum
- set
- showcased
- shown
- signals
- similar
- simulation
- simulations
- simulator
- SIX
- Skin
- slower
- small
- smaller
- sodium
- Software
- soil
- solution
- Source
- Spectroscopy
- Spectrum
- speed
- sphere
- squares
- standard
- started
- stirring
- Strip
- Stripes
- Study
- subject
- Subsequently
- Surface
- suspended
- system
- T
- table
- taken
- Tempo
- terms
- test
- Testing
- tests
- than
- that
- The
- then
- thermostat
- These
- they
- this
- those
- three
- threshold
- Through
- throughout
- Thus
- time
- to
- Total
- Transform
- typically
- under
- understand
- unfolding
- until
- used
- using
- utilized
- Vacuum
- VALIDATE
- value
- Values
- van
- varying
- verified
- versa
- via
- vice
- visualize
- volumes
- was
- Water
- wavelengths
- Way..
- we
- WELL
- were
- which
- while
- widely
- with
- withdrawn
- within
- without
- wood
- Work
- X
- zephyrnet