SNEAK PEEK:
- MKR market shows exceptional gain, reflecting positive sentiment.
- Bulls have complete control of the MKR market.
- Caution is advised for investors due to an overbought RSI reading.
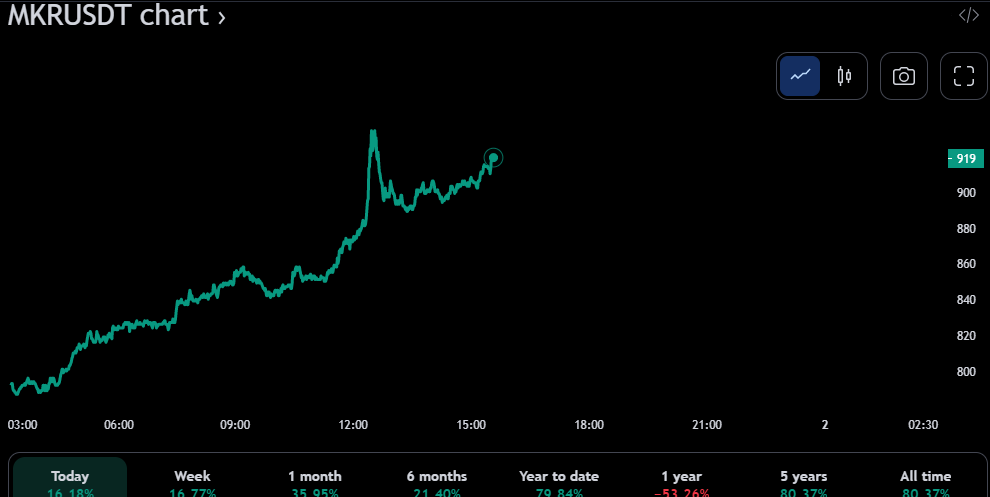
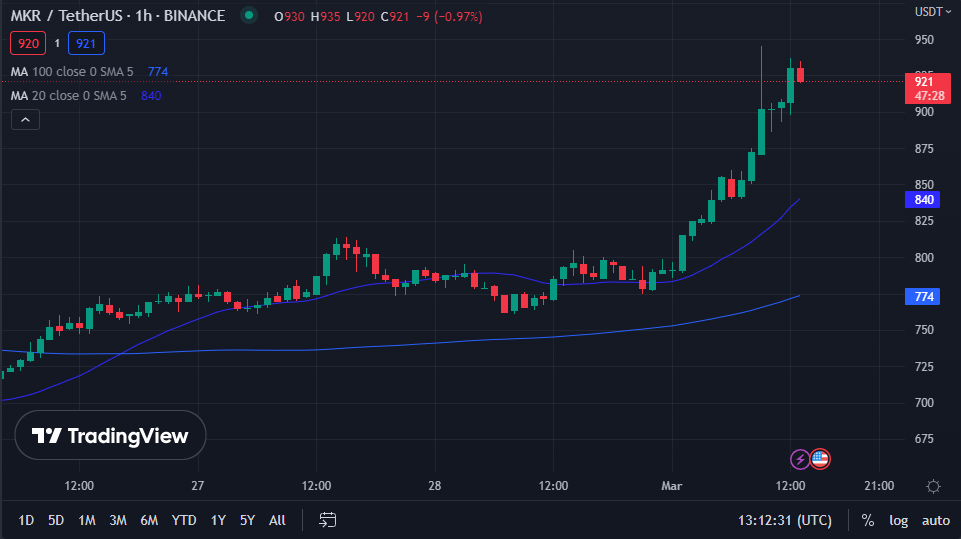
In the previous 24 hours, the bulls have outnumbered the bears in the Maker (MKR) market, with prices ranging between an intra-day high of $929.65 (the 90-day high) and an intra-day low of $778.38. This is an exceptional gain for MKR in such a short period of time, indicating great trust and interest in the digital currency. At the time of publication, the bullish strength had boosted MKR’s price by 16.72% to $904.03.
This gain reflects the market’s positive sentiment toward MKR, which has had its market value and 24-hour trading volume rise by 17.06% and 85.70%, respectively, to $887,180,585 and $102,145,401. As a result of this shift, MKR now ranks #59 in terms of cryptocurrency market capitalization.
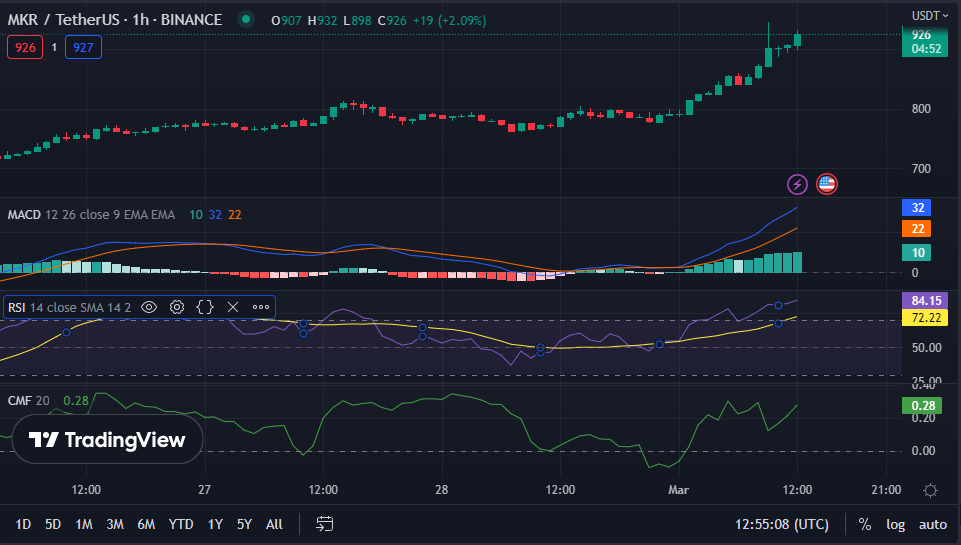
In the MKR 1-hour price chart, the MACD blue line soars over its signal line with a value of 32, indicating that the bulls have complete control of the market. In the 1-hour price chart, the vast divergence between the blue line and the signal line has allowed the bulls to drive MKR higher, with a reading of 32 indicating that buying pressure is intense. The histogram is positive, with a value of 10, meaning that the bulls are likely to maintain market control.
Considering the Relative Strength Index (RSI) is trending north and reading 83.69, indicating that the present uptrend is significantly overbought, investors should exercise caution when joining the market owing to the high likelihood of a downward correction.
The Chaikin Money Flow (CMF) score of 0.25 indicates that money flows in the market, indicating that the bulls are still in power. However, despite the overwhelming signs of a bullish market, investors should be cautious since the RSI reading of 83.69 indicates a significant likelihood of a negative correction.
The 20-day MA crossed above the 100-day MA, indicating a solid bullish trend in the market. This crossing implies that the short-term trend has shifted upward and will likely continue to be positive soon. Since the price action swings above both MAs, it indicates that the bulls are in charge and may drive prices higher.
While the bullish crossing is prominent, paying attention to the market’s entrance and exit points is critical.
When the price is near the 20-day moving average, the entry point should be identified, and the exit point may be determined when the price movement begins to decline and falls below both MAs. This idea is because when price action goes below both MAs, it signifies a change in momentum and may result in a protracted negative move.
Bulls dominate Maker’s market as prices surge, but investors should exercise caution due to overbought conditions and the potential for a negative correction.
Disclaimer: In good faith, we disclose our thoughts and opinions in our price analysis, as well as all the facts we give. Each reader is responsible for his or her own investigation. Reader discretion is advised before taking any action.
- SEO Powered Content & PR Distribution. Get Amplified Today.
- Platoblockchain. Web3 Metaverse Intelligence. Knowledge Amplified. Access Here.
- Source: https://investorbites.com/maker-mkr-price-analysis-1-3/
- 10
- a
- above
- Action
- All
- analysis
- and
- attention
- average
- Bears
- because
- before
- below
- between
- Blue
- Boosted
- Bullish
- Bulls
- Buying
- capitalization
- cautious
- change
- charge
- Chart
- CoinMarketCap
- complete
- conditions
- continue
- control
- critical
- Crossed
- cryptocurrency
- cryptocurrency market
- Currency
- Decline
- Despite
- determined
- digital
- digital currency
- Disclose
- discretion
- Divergence
- dominate
- downward
- drive
- each
- entrance
- entry
- exceptional
- Exercise
- Exit
- faith
- Falls
- flow
- Flows
- For Investors
- Gain
- Give
- Goes
- good
- great
- High
- higher
- hitting
- HOURS
- However
- HTTPS
- idea
- identified
- important
- in
- index
- indicates
- interest
- internal
- investigation
- Investors
- IT
- joining
- likely
- Line
- Low
- MACD
- maintain
- maker
- Maker (MKR)
- Maker price analysis
- Market
- Market Capitalization
- Market News
- MAS
- meaning
- MKR
- MKR/USD
- Momentum
- money
- move
- movement
- moving
- moving average
- Near
- negative
- news
- North
- Opinions
- own
- paying
- period
- plato
- Plato Data Intelligence
- PlatoData
- Point
- points
- positive
- potential
- power
- present
- pressure
- previous
- price
- PRICE ACTION
- Price Analysis
- price chart
- Prices
- prominent
- Publication
- ranging
- ranks
- Reader
- Reading
- reflects
- relative strength index
- Relative Strength Index (RSI)
- responsible
- result
- Revealed
- Rise
- rsi
- sentiment
- shift
- Short
- short-term
- should
- Shows
- Signal
- significant
- significantly
- signifies
- Signs
- since
- Soars
- solid
- Soon
- Source
- stablecoin
- Still
- strength
- such
- surge
- Swings
- taking
- terms
- The
- time
- to
- toward
- Trading
- trading volume
- TradingView
- Trend
- trending
- Trust
- uptrend
- upward
- value
- Vast
- volume
- What
- What is
- which
- will
- zephyrnet