SNEAK PEEK:
- Polygon (MATIC) token price has risen steadily over the past week.
- Indications indicate MATIC bulls’ strength will prevail.
- According to the one-day chart, Polygon (MATIC) has exceeded the Bollinger band.
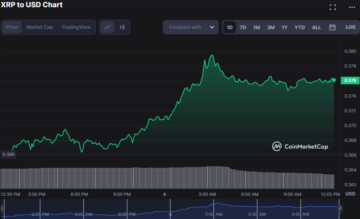
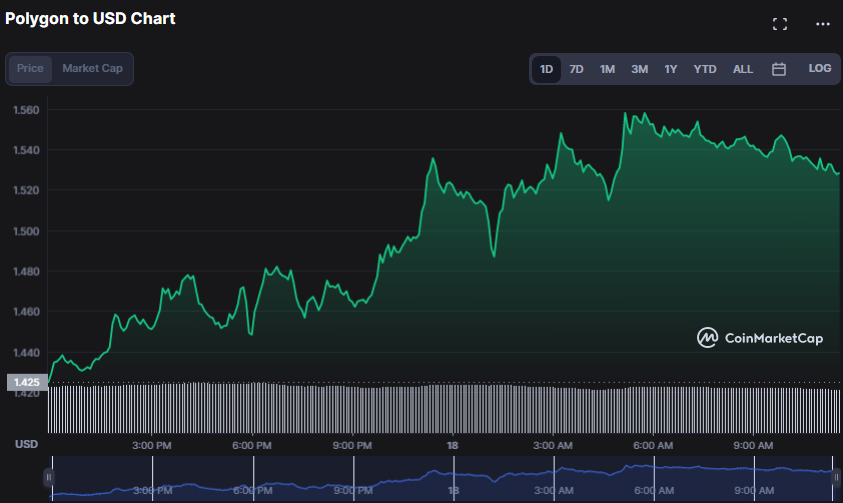
According to the Polygon (MATIC) price prediction, the token has steadily risen in value over the past week. When the market began for business earlier this week, the coin was trading at a low of $1.24 on a volume of $862.76 million.
Further, the Polygon (MATIC) bulls now possess the upper hand as they attempt to propel the price over $1.56, which currently stands as resistance for the token. Notably, if buyers push prices higher than $1.56, the last resistance barrier will become a support level. However, if the bears seize control of the trend and drive the price of MATIC below $1.42, this support level becomes resistant.
As of this writing, one MATIC token is worth $1.53, representing an intraday increase of 7.32 percent per Coinmarketcap’s data. In addition, Polygon’s (MATIC) market value has increased by 6.30%, hitting $13 billion, and the stock price has reached new intraday highs of $1.535, $1.547, and $1.605.
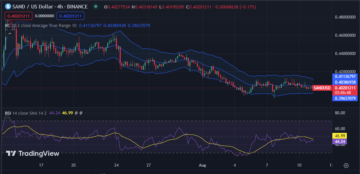
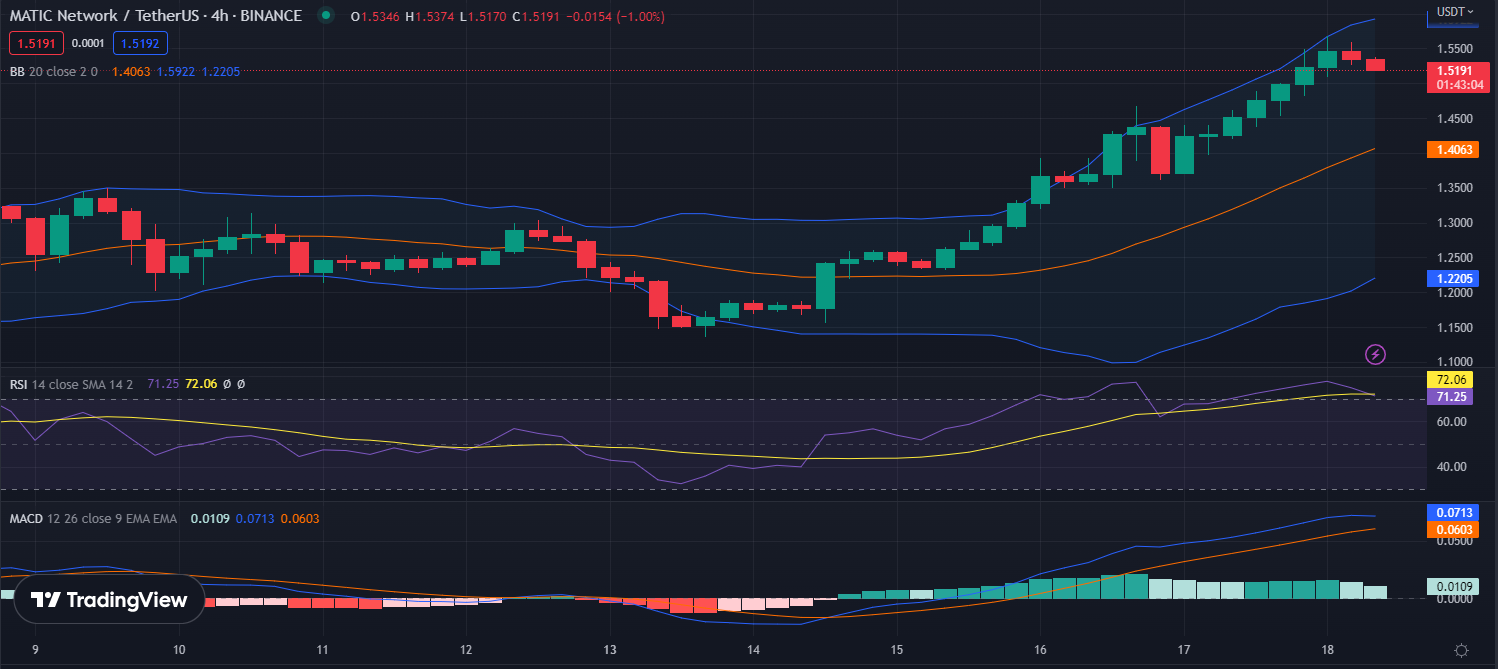
The 4-hour chart technical analysis reveals that the Bollinger bands are broadening, suggesting higher price volatility for Polygon (MATIC). Also, the Bollinger bands show that MATIC is now trading between $1.59 and $1.22, and an imminent breach of the upper hand is anticipated.
Nevertheless, the RSI is presently at 71.35, much over the overbought threshold of 70, indicating that buyers are in control of the market. Polygon’s (MATIC) price is expected to make significant gains or losses in the following days, as the Moving Average Convergence Divergence indicator is also positive.
Notably, the near-term direction for Polygon (MATIC) is optimistic, and if buyers can keep the price above the $1.56 barrier mark, the token might reach a new all-time high.
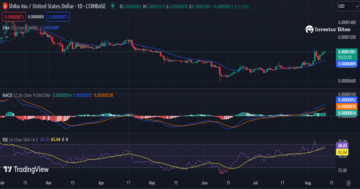
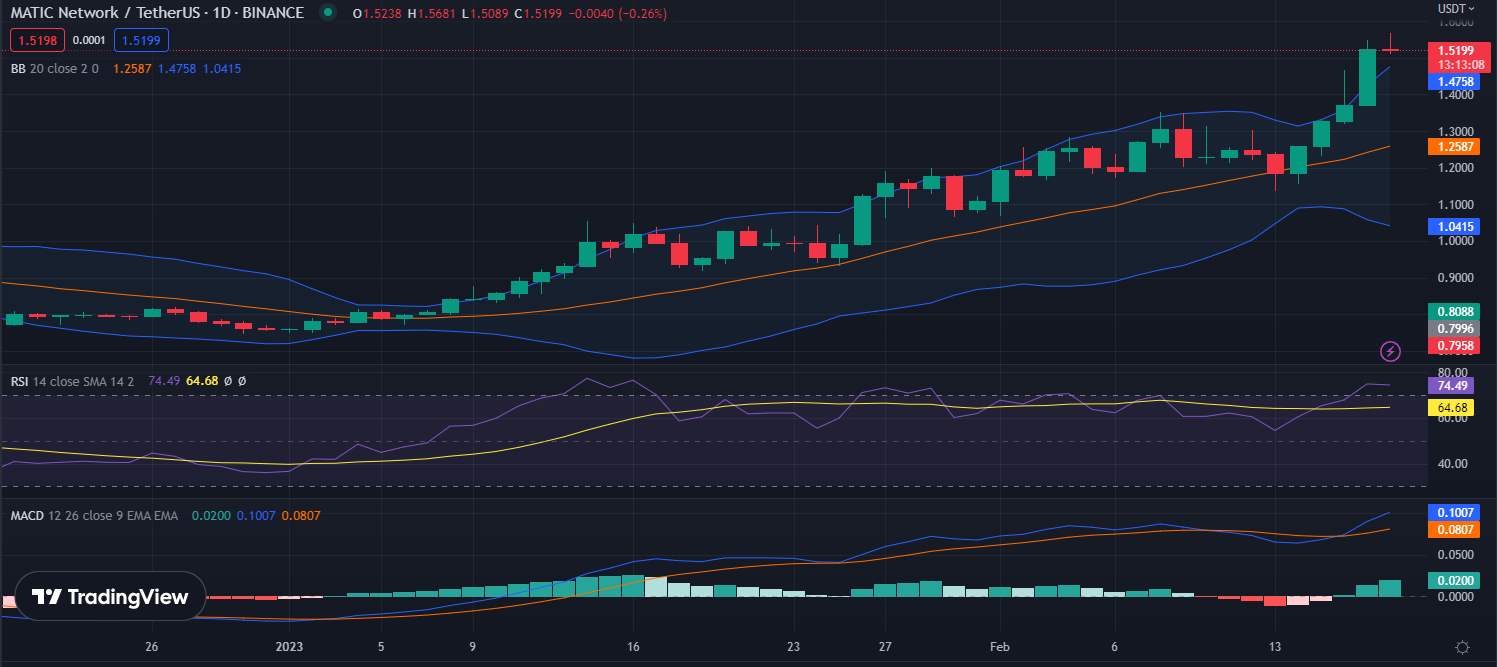
The Relative Strength Index on the 24-hour chart for the MATIC token shows that the token’s price is now in the overbought region. The buying trend is continuing as the RSI is above the 70 levels. As a result, more price gains may be on the cards in the near future.
Even more encouraging is the Moving Average Convergence Divergence indicator is still in the bullish zone, suggesting buyers still have plenty of purchasing power to keep the present trend going. The MATIC token, on the other hand, has broken above the Bollinger band’s upper boundary, suggesting further gains are ahead. The upper limit of the Bollinger band is $1.47, while the bottom limit is $1.04.
In conclusion, the technical indications point to a positive trend in MATIC/USDT that is expected to persist.
Disclaimer: In good faith, we disclose our thoughts and opinions in our price analysis, as well as all the facts we give. Each reader is responsible for his or her own investigation. Reader discretion is advised before taking any action.
- SEO Powered Content & PR Distribution. Get Amplified Today.
- Platoblockchain. Web3 Metaverse Intelligence. Knowledge Amplified. Access Here.
- Source: https://investorbites.com/polygon-matic-price-analysis-18-2/
- 10
- 7
- 70
- a
- above
- Action
- addition
- ahead
- All
- analysis
- and
- Anticipated
- average
- BAND
- band’s
- barrier
- Bears
- become
- becomes
- before
- began
- below
- between
- Billion
- Bollinger bands
- Bottom
- breach
- Broken
- Bullish
- Bulls
- business
- buyers
- Buying
- Cards
- Chart
- Coin
- CoinMarketCap
- conclusion
- continuing
- control
- Convergence
- Currently
- data
- Days
- direction
- Disclose
- discretion
- Divergence
- drive
- each
- Earlier
- encouraging
- expected
- following
- further
- future
- Gains
- Give
- going
- good
- hand
- High
- higher
- Highs
- hitting
- However
- HTTPS
- important
- in
- Increase
- increased
- index
- indicate
- indications
- Indicator
- internal
- investigation
- Keep
- largest
- Last
- Level
- levels
- LIMIT
- losses
- Low
- make
- mark
- Market
- Market News
- Matic
- MATIC/USD
- might
- million
- more
- moving
- moving average
- Near
- network
- New
- news
- notably
- ONE
- Opinions
- Optimistic
- Other
- own
- past
- percent
- plato
- Plato Data Intelligence
- PlatoData
- Plenty
- Point
- Polygon
- Polygon (MATIC)
- Polygon (MATIC) Price
- Polygon Price
- Polygon price analysis
- Polygon’s
- positive
- power
- prediction
- present
- price
- Price Analysis
- price chart
- Price Prediction
- Prices
- Propel
- purchasing
- Push
- reach
- reached
- Reader
- region
- relative strength index
- representing
- Resistance
- resistant
- responsible
- result
- Revealed
- Reveals
- Risen
- rsi
- Seize
- show
- Shows
- significant
- Source
- stablecoin
- stands
- Still
- stock
- strength
- support
- support level
- taking
- Technical
- Technical Analysis
- The
- this week
- threshold
- to
- token
- Trading
- TradingView
- Trend
- value
- Volatility
- volume
- week
- What
- What is
- which
- while
- will
- worth
- writing
- zephyrnet