SNEAK PEEK
- Bears control the LUNC market, causing a significant price and capitalization decline.
- Low volatility and negative momentum indicate caution for investors and potential market decline.
- Intense selling pressure on LUNC suggests possible price reversal and short-selling opportunities.
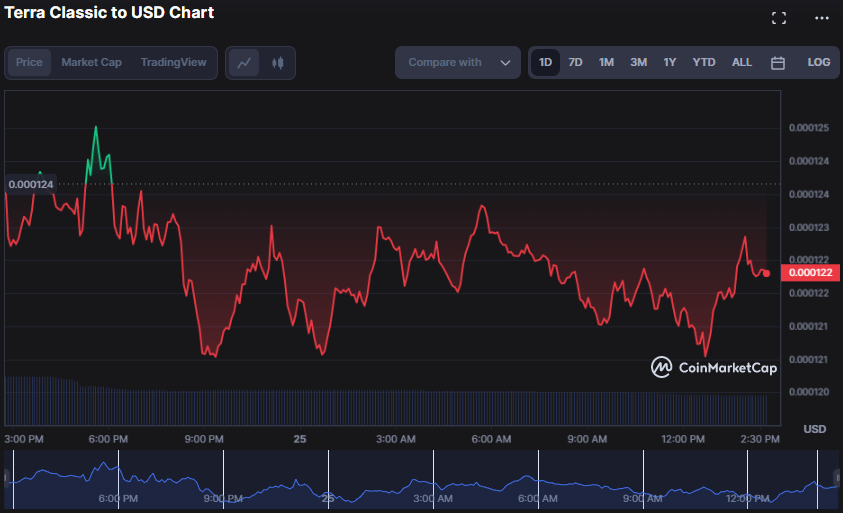
The Terra Classic market (LUNC) has been under the bear’s control over the last 24 hours, with the bears driving the price to an intraday low of $0.000121 from an intra-day high of $0.0001246. This recession demonstrates that the bears have been driving down prices and controlling the market in recent hours.
The price had decreased from 1.15% to $0.0001218 due to persistent bearish pressure as of press time. The increase in selling pressure evidenced in LUNC is attributable to investors who benefited from the price increase and are cashing out their gains hence this decline.
The recession caused a 1.16% drop in market capitalization to $719,287,890, while a 37.18% drop in 24-hour trading volume to $43,480,762. This decline is due to investors’ caution and uncertainty as they closely monitor the LUNC market and postpone making significant investments until they perceive a recovery.
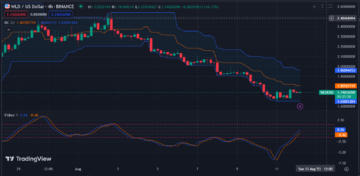
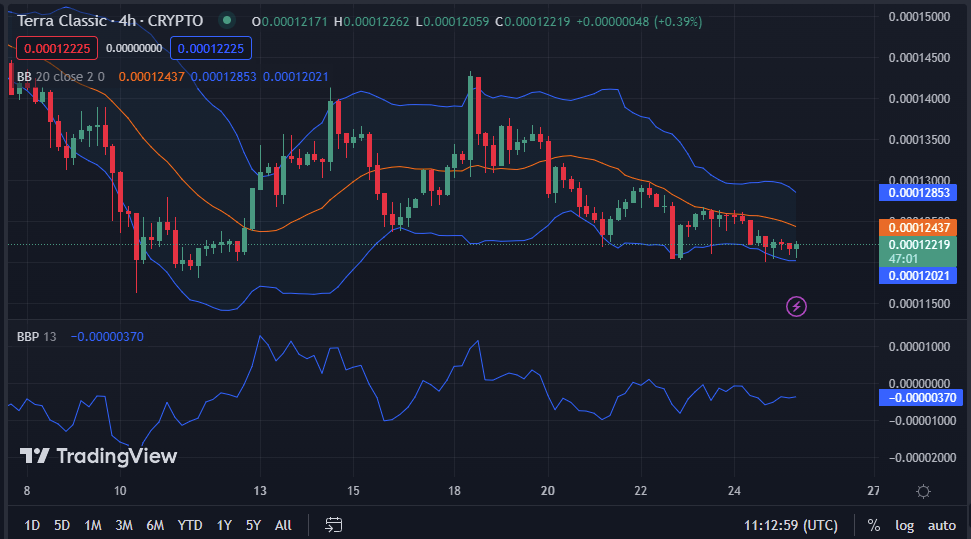
With a negative value of -0.00000423, the Bull Bear Power value (BBP) has its line facing south. This suggests that the bears are currently in charge of the market, and prices are under pressure to decline. The descending momentum shows that the price has broken below the crucial support level and appears to be strengthening on the 4-Hour price chart.
On the LUNC market’s 4-hour price chart, the Bollinger Bands (BB) are facing south with readings of 0.00012854 up and 0.00012019 down. This demonstrates that the LUNC market is going through a period of low volatility and that the price will probably stay within the two bands. The possibility of an impending market decline indicates that traders are closing out their positions.
The Commodity Channel Index (CCI) is negative on the 4-hour price chart of the LUNC market with a value of -100.21. This level suggests that the market is under intense selling pressure and that a price reversal will likely occur soon. Even though the price of LUNC has dropped, a significant price adjustment may be just around the corner.
The bands face south on the Kelter Channels (KC), with upper and lower band values of 0.00012917 and 0.00011949, respectively. This movement indicates that the market is in a strong negative trend, and traders should consider selling their holdings or opening short transactions. If the price movement breaks through the bottom band, it might imply continued negative momentum and possible profit-taking or short-selling opportunities.
Investors are cautious as bears take control of the LUNC market, causing a drop in price and market cap. Traders are urged to consider selling or short positions.
Disclaimer: Cryptocurrency price is highly speculative and volatile and should not be considered financial advice. Past and current performance is not indicative of future results. Always research and consult with a financial advisor before making investment decisions.
- SEO Powered Content & PR Distribution. Get Amplified Today.
- Platoblockchain. Web3 Metaverse Intelligence. Knowledge Amplified. Access Here.
- Source: https://investorbites.com/terra-classic-price-analysis-25-3/
- :is
- $UP
- 1
- 15%
- a
- Adjustment
- advice
- advisor
- always
- analysis
- and
- ARE
- around
- AS
- BAND
- BE
- Bear
- bearish
- Bears
- before
- below
- Bollinger bands
- Bottom
- breaks
- Broken
- bull
- cap
- capitalization
- caused
- causing
- cautious
- Channel
- channels
- charge
- Chart
- classic
- closely
- closing
- CoinMarketCap
- commodity
- Consider
- considered
- continued
- control
- controlling
- Corner
- crucial
- Current
- Currently
- decisions
- Decline
- demonstrates
- down
- driving
- Drop
- dropped
- Even
- external
- Face
- facing
- financial
- financial advice
- For
- For Investors
- from
- future
- Gains
- going
- Have
- High
- highly
- Holdings
- HOURS
- HTTPS
- impending
- in
- Increase
- index
- indicate
- indicates
- internal
- investment
- Investments
- Investors
- IT
- ITS
- Last
- Level
- likely
- Line
- Low
- LUNC
- LUNC/USD
- Making
- Market
- Market Cap
- Market Capitalization
- Market News
- max-width
- might
- Momentum
- Monitor
- movement
- negative
- news
- of
- on
- opening
- opportunities
- past
- performance
- period
- plato
- Plato Data Intelligence
- PlatoData
- Plummet
- positions
- possibility
- possible
- potential
- power
- press
- pressure
- price
- Price Analysis
- price chart
- Price Increase
- Prices
- probably
- recent
- recession
- recovery
- research
- Results
- Reversal
- Selling
- Short
- Short-selling
- should
- Shows
- significant
- Soon
- Source
- South
- stay
- strengthening
- strong
- Suggests
- support
- support level
- Take
- Terra
- Terra Classic
- Terra classic price analysis
- that
- The
- their
- Through
- time
- to
- Traders
- Trading
- trading volume
- Transactions
- Trend
- Uncertainty
- under
- value
- Values
- View
- volatile
- Volatility
- volume
- while
- WHO
- will
- with
- within
- zephyrnet