SNEAK PEEK
- Transfer of $32.5 million in SAND to exchanges impacts market dynamics.
- Bears hold sway as SAND nears resistance, hindering bull control.
- Potential bullish reversal signals offer hope for SAND investors.
The Sandbox Genesis transferred $32.5 million (80,500,000 $SAND) to Blinance, OKX, and Gemini. According to Tokenunlocks, 16.16% of the circulating supply, or 332.55 million SAND ($134 million), will be unlocked after three days. This unlocking of the circulating supply will provide more liquidity to the market and potentially increase trading activity for $SAND.
Note that 80.5M $SAND($32.5M) from The Sandbox: Genesis has been transferred to #Blinance, #OKX and #Gemini in the last 8 hours.
According to @Token_Unlocks, 332.55M $SAND ($134M) will be unlocked after 3 days, 16.16% of the circulating supply.https://t.co/p0ianQ1U4H pic.twitter.com/qkg2fDBxvf
— Lookonchain (@lookonchain) August 11, 2023
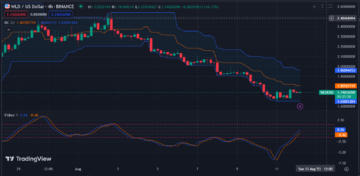
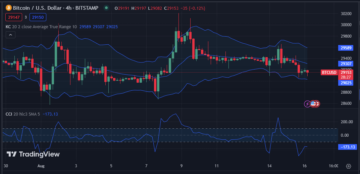
However, the Sandbox bulls have struggled to acquire market control over the past 24 hours but have yet to be successful, as they have been unable to surpass the $0.4082 resistance level. As a result of this hesitation, bears recently seized control of SAND, causing the price to drop to an intraday low of $0.4007.
SAND’s price had decreased by 0.19% during this writing to $0.4023. Due to the recession, SAND’s market capitalization and 24-hour trading volume decreased by 0.14% and 6.99%, respectively, to $827,928,147 and $67,948,627. This decline indicates that bears still have the upper hand in the market, and traders view the bulls’ odds of making a comeback as low.
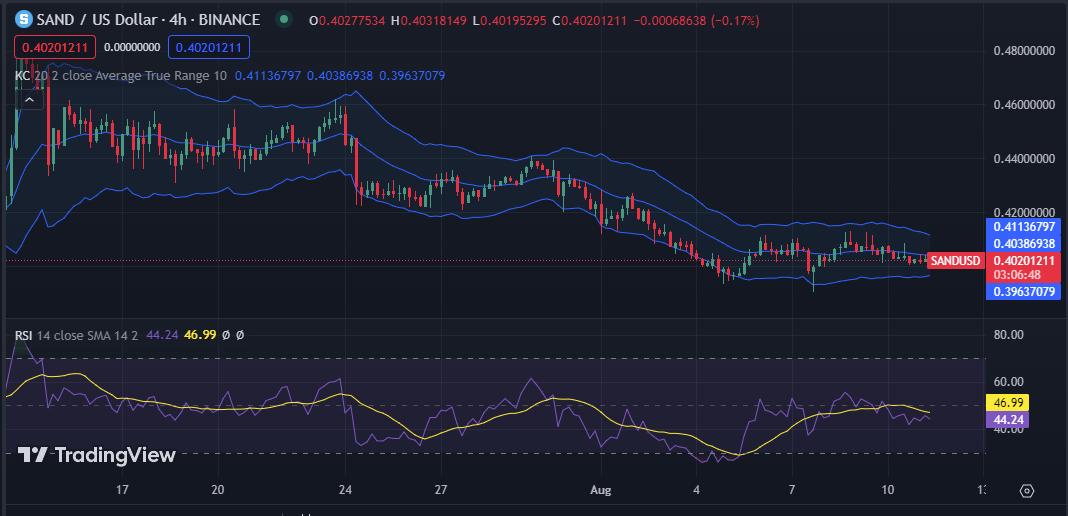
The Keltner Channel bands are moving south, with the upper band at 0.41136797 and the lower band at 0.39637079, indicating that the SAND’s bearish momentum is robust and likely to persist for the foreseeable future. This move reflects traders’ expectation that the price of SAND will continue to fall rapidly, but short-term traders may have a fantastic opportunity to profit.
The SAND’s Relative Strength Index (RSI) value of 44.24 and recent decline below its signal line indicate that it is currently trading in an unfavorable market, making it a potential buy for investors seeking to profit from current market conditions. This decline indicates that selling pressure is greater than purchasing demand, indicating that the value of SAND will continue to decline.
Therefore, investors should assess whether the expected return of investing in SAND exceeds the risk of future value decline.
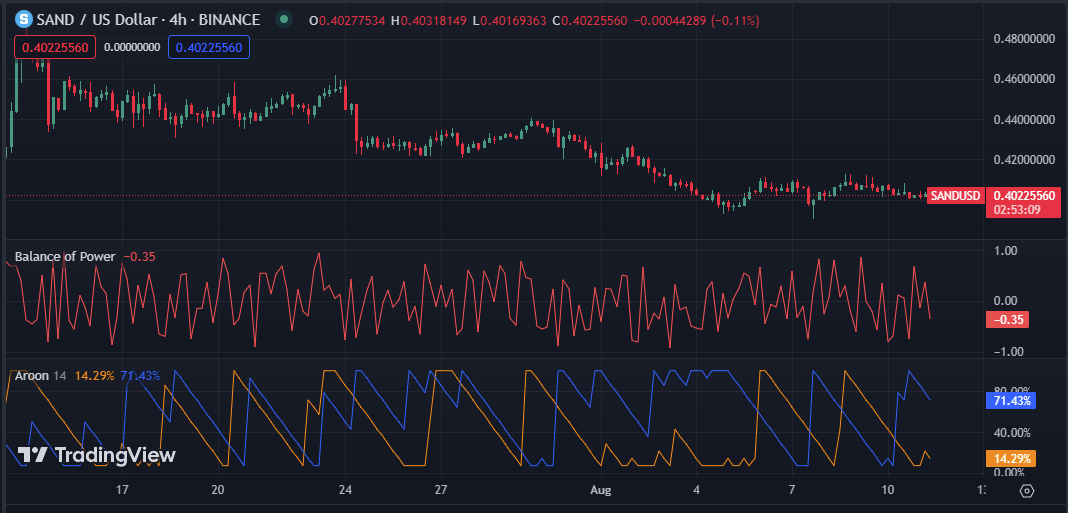
The Aroon up rating of 14.29% and the Aroon down rating of 71.43% on SAND’s price chart indicate that the price of SAND is on a significant downward trend. The high Aroon down rating implies that SAND has been making lower lows repeatedly and may continue to fall.
If the Aroon down rating keeps going high, it might indicate that the downward trend in SAND prices is likely to continue. However, if the Aroon up rating begins to rise and surpass the Aroon down rating, it may indicate a possible turnaround in the negative trend.
On the 4-hour price chart for SAND, the Balance of Power (BOP) indicator points south and has a value of -0.35, indicating more selling pressure in the market and possibly the beginning of a bearish trend. Even though the price of SAND has decreased, a significant price increase may be imminent.
In conclusion, Bears tighten their grip on SAND as resistance holds, but the potential for reversal signals offers hope for strategic investors.
Disclaimer: Cryptocurrency price is highly speculative and volatile and should not be considered financial advice. Past and current performance is not indicative of future results. Always research and consult with a financial advisor before making investment decisions.
- SEO Powered Content & PR Distribution. Get Amplified Today.
- PlatoData.Network Vertical Generative Ai. Empower Yourself. Access Here.
- PlatoAiStream. Web3 Intelligence. Knowledge Amplified. Access Here.
- PlatoESG. Automotive / EVs, Carbon, CleanTech, Energy, Environment, Solar, Waste Management. Access Here.
- PlatoHealth. Biotech and Clinical Trials Intelligence. Access Here.
- ChartPrime. Elevate your Trading Game with ChartPrime. Access Here.
- BlockOffsets. Modernizing Environmental Offset Ownership. Access Here.
- Source: https://investorbites.com/sandbox-sand-price-analysis-11-08/
- :has
- :is
- :not
- $UP
- 000
- 10
- 11
- 14
- 16
- 22
- 24
- 500
- 8
- 80
- a
- According
- acquire
- activity
- advice
- advisor
- After
- always
- Amid
- an
- analysis
- and
- ARE
- AS
- assess
- At
- Balance
- BAND
- BE
- bearish
- Bearish Momentum
- Bears
- been
- before
- Beginning
- below
- bull
- Bullish
- Bulls
- but
- buy
- by
- capitalization
- causing
- Center
- Channel
- Chart
- circulating
- Comeback
- conclusion
- conditions
- considered
- continue
- control
- Current
- Currently
- Days
- decisions
- Decline
- Demand
- down
- downward
- Drop
- due
- during
- dynamics
- Even
- exceeds
- Exchanges
- expectation
- expected
- external
- Fall
- fantastic
- financial
- financial advice
- For
- For Investors
- foreseeable
- from
- future
- Gemini
- Genesis
- going
- greater
- Ground
- had
- hand
- Have
- High
- highly
- hold
- holds
- hope
- HOURS
- However
- HTTPS
- if
- Impacts
- in
- Increase
- index
- indicate
- indicates
- indicating
- indicative
- Indicator
- internal
- investing
- investment
- investor
- Investors
- IT
- ITS
- Last
- Level
- likely
- Line
- Liquidity
- Low
- lower
- Lows
- Making
- Market
- Market Capitalization
- market conditions
- Market News
- May..
- might
- million
- Momentum
- more
- move
- moving
- negative
- news
- Odds
- of
- offer
- Offers
- OKX
- on
- Opportunity
- over
- past
- performance
- plato
- Plato Data Intelligence
- PlatoData
- points
- possible
- possibly
- potential
- potentially
- power
- pressure
- price
- Price Analysis
- price chart
- Price Increase
- Prices
- Profit
- provide
- purchasing
- rapidly
- rating
- recent
- recently
- recession
- reflects
- relative
- relative strength index
- Relative Strength Index (RSI)
- REPEATEDLY
- research
- Resistance
- result
- Results
- return
- Reversal
- Rise
- Risk
- robust
- rsi
- SAND
- sandbox
- sandbox price analysis
- seeking
- seized
- Selling
- short-term
- should
- Signal
- signals
- significant
- Source
- South
- Spark
- speculative
- Still
- Strategic
- strength
- successful
- supply
- surpass
- than
- that
- The
- The Sandbox
- their
- they
- this
- though?
- three
- tighten
- to
- Traders
- Trading
- trading volume
- TradingView
- transferred
- Trend
- unable
- unlocked
- unlocking
- value
- View
- volatile
- volume
- whether
- will
- with
- writing
- yet
- zephyrnet