All the experiments and experimental conditions described throughout this study comply with the ethical regulations set forth by the institutional review board of the medical faculty of the Ludwig-Maximilians-Universität and the Regierung von Oberbayern (approval of animal experiments).
Chemicals, antibodies and cell lines
Unless otherwise mentioned, chemicals used within this work were purchased from Sigma-Aldrich and all the IgG antibodies, RPMI, PBS, FBS and penicillin–streptomycin were purchased from Thermo Fisher.
The human cell lines Jurkat (T-cell leukaemia, DSMZ, no. ACC-282), NALM-6 (B-cell precursor leukaemia, DSMZ, no. ACC-128), MCF-7 (breast adenocarcinoma, DSMZ, no. ACC-115) and Molm-13 (acute myeloid leukaemia, DSMZ, no. ACC 554) were obtained from DMSZ. Human cell line LNCaP (metastatic lesion of prostate adenocarcinoma, CLS, 300265) was obtained from CLS. All the cell lines were stored in liquid nitrogen. Successful cell-line authentication was done via polymerase chain reaction for Jurkat, NALM-6, LNCap and MCF-7.
Jurkat, NALM-6 and Molm-13 cells were grown in RPMI 1640 medium, supplemented with 10% FBS, penicillin (200 U ml–1), streptomycin (200 µg ml–1) and with or without additional 20 mM l-glutamine for Jurkat and NALM-6, respectively. The MCF-7 cells were grown in high-glucose (25 mM d-glucose) Dulbecco’s modified Eagle’s medium medium, supplemented with 5% FBS, penicillin (200 U ml–1), streptomycin (200 µg ml–1) and 4 mM l-glutamine and passaged using Trypsin-EDTA (0.05%). Both SK-BR-3 and LNCaP cells were grown in RPMI 1640 medium, supplemented with 20% FBS, penicillin (200 U ml–1), streptomycin (200 µg ml–1) and 2 mM l-glutamine and passaged using TrypLE Select Enzyme.
The murine A20 cell line was stored in liquid nitrogen and grown in RPMI 1640, supplemented with 10% FBS, penicillin (200 U ml–1), streptomycin (200 µg ml–1), 200 µM l-glutamine, 25 mM d-glucose, 10 mM HEPES and 1 mM sodium pyruvate.
The cells were cultivated in T-75 cell culture flasks at 37 °C and 5% CO2. The cells were maintained according to the instructions from DSMZ and used for flow cytometric and cell-based assays up to a maximum of 15 passages. This cell line was used as a murine B-cell lymphoma model.
For in vivo models, NALM-6 tumour cells were lentivirally transduced with a pCDH-EF1a-eFly-eGFP plasmid as previously described49,50. Short tandem repeat profiling was used to verify the origin of this cell line.
For flow cytometric experiments, the following antibodies were used as purchased.
|
Antibody |
Company |
|---|---|
|
CD8a monoclonal antibody (RPA-T8) |
Thermo Fisher |
|
CD69 monoclonal antibody (FN50) |
Thermo Fisher |
|
PerCP-eFluor 710 CD4 monoclonal antibody (RPA-T4), PE |
Thermo Fisher |
|
CD25 monoclonal antibody (PC61.5), PE-eFluor 610 |
Thermo Fisher |
Folding of DNA origami objects (chassis)
The reaction mixtures contained scaffold DNA at a concentration of 50 nM and oligonucleotide strands at 200 nM each. The reaction buffer included 5 mM Tris, 1 mM EDTA, 5 mM NaCl (pH 8) and 20 mM MgCl2. The reaction mixtures were subjected to a thermal annealing ramp using Tetrad (MJ Research, now Bio-Rad) thermal cycling devices. Oligonucleotides were obtained from IDT. DNA scaffolds were produced in-house according to another work51. The table below shows the folding ramps used to assemble the objects described in the manuscript.
|
Object |
Scaffold type |
Highest temperature for 30 min (°C) |
Ramp |
Incubation temperature (°C) |
|---|---|---|---|---|
|
Medium brick |
8,064 |
65 |
55 to 50; 1 °C/1 h |
25 |
|
Small brick |
1,033 |
65 |
56 to 54; 1 °C/2 h |
25 |
Gel electrophoresis of PTEs
Folded DNA nanostructures were electrophoresed on 1.5% to 3.5% agarose gels containing 0.5× TBE and MgCl2 at different concentrations for around 2 h at 70 V bias voltage in a gel box immersed in a water bath, unless specified otherwise. The electrophoresed agarose gels were scanned using a Typhoon FLA 9500 laser scanner (GE Healthcare) at 50 µm per pixel resolution. The resulting 16-bit TIFF images were analysed using ImageJ v. 1.440. For each lane that contained the sample, a cross-sectional intensity profile was calculated by averaging over grey-scale values within a 50-pixel-wide box. The peak intensities of the monomers and higher-ordered bands were determined in the target band. These intensity values have been used for further analysis.
Purification, enrichment and in vitro stabilization of PTEs
After the folding reaction, all the reaction products were purified using PEG precipitation52. For concentrating DNA origami objects (chassis or PTEs), PEG precipitation or ultrafiltration was used. All the procedures were performed as previously described53. Concentrations of DNA origami objects were analysed with a Nanodrop 8000 instrument (Thermo Fisher). Before using the objects in cell culture assays, the objects were stabilized for use in low-ionic-strength buffers and the presence of nucleases. To that end, we used the protocol from another work22 and coated all our structures with K10-PEG oligolysine, purchased from Alamanda Polymers.
Antibody–DNA conjugation, antibody digestion and attachment to DNA origami objects
Conjugation of full-sized IgG antibodies: oligonucleotides modified with 5’- or a 3’-thiol modification were purchased, HPLC purified and dried (Biomers). The oligos were dissolved in PBS (100 mM NaPi, 150 mM NaCl, pH 7.2) with 5 mM TCEP and incubated for 1 h at RT. After purification, 10 nmol of the reduced thiol oligo was mixed with 10 equivalents of sulfosuccinimidyl 4-(N-maleimidomethyl) cyclohexane-1-carboxylate (Sulfo-SMCC; dissolved in ddH2O) (Thermo Fisher) for 15 min. After purification, including buffer change to PBS (pH 8), 100 µg of antibody in PBS (pH 8) was added. The conjugate was subsequently purified by ion exchange chromatography (proFIRE, Dynamic Biosensors) using a NaCl gradient of 150–1,000 mM in PBS (pH 7.2). Purified oligo–antibody conjugates were analysed by sodium dodecyl sulfate–polyacrylamide gel electrophoresis and agarose gel electrophoresis.
Preparation of Fab fragments: full-sized IgGs were digested and purified using the Pierce Fab Preparation Kit (Thermo Fisher, 44985) according to the supplier’s manual. Briefly, IgGs were incubated with papain beads and purified from Fc fragments using Protein-A affinity beads. Fab generation was checked using sodium dodecyl sulfate–polyacrylamide gel electrophoresis.
Conjugation of Fab fragments: to avoid an orientation where the F(ab)’s paratope points towards the DNA origami chassis, we relied on a site-specific conjugation method similar to another work54. In brief, maleimide-modified DNA was purchased from Biomers or prepared by mixing amine-modified DNA with an SMCC crosslinker and subsequent ultracentrifugation (10k filters, Amicon). Fab fragments, which were produced using the papaine digestion of IgG (Pierce Fab Preparation Kit, Thermo Fisher, 44985) were reduced with 5 mM TCEP for 30 min. Excess TCEP was removed using ultracentrifugation (10k filters, Amicon), and mixed with maleimide-modified DNA strands in 50 mM HEPES with 200 mM NaCl at pH 6.7. Reactions were performed overnight at room temperature. This conjugation technique results in single- and double-labelled Fab fragments. Single-labelled F(ab)–DNA conjugates were purified using ion exchange chromatography.
Conjugation of scFv: maleimide-modified DNA was purchased from Biomers or prepared by mixing amine-modified DNA with SMCC crosslinker. scFv contained a free N-terminal cysteine and were expressed and purchased from Genscript or Icosagen. The reaction was carried out as described for the Fab fragments.
Attachment of antibody–DNA conjugates to DNA origami objects: antibody–DNA conjugates and DNA origami objects with the corresponding binding sites were incubated in equimolar ratios for 1 h at 37 °C.
Negative-stain TEM
Preparation, acquisition and data processing
Purified reaction products were adsorbed on glow-discharged Cu400 TEM grids (Science Services) and stained using a 2% aqueous uranyl formate solution containing 25 mM sodium hydroxide. The samples were incubated for 30 s at 20–25 mM Mg2+. Magnifications between ×10,000 to ×30,000 were used for acquiring the data.
Imaging was performed on different microscopes.
|
Microscope |
Operating voltage (kV) |
Camera |
Objects |
|---|---|---|---|
|
Philips CM 100 |
100 |
AMT 4 megapixel charge-coupled device camera |
Bricks S, M |
|
FEI Tecnai 120 |
120 |
TemCam F416 (4k × 4k) |
Bricks S, M |
TEM micrographs used in the figures were high-pass filtered to remove long-range staining gradients and the contrast was auto-levelled (Adobe Photoshop CS6).
Fluorescence microscopy
Fluorescence microscopy experiments were obtained on a Thermo Fisher CX7 confocal microscope with an on-stage incubator. Incubation conditions for time-resolved measurements were identical to the cell culture conditions used for the respective cell lines. The samples were incubated on 96-well ibidi plates (89626).
Cell-based assays
Cell surface binding experiments
For flow cytometric experiments, the cells were grown to a cell density of 1.5–2.0 × 10⁶ cells ml−1 in T-75 cell culture flasks. The cells were centrifuged for 5 min at 160×g and washed with ice-cold PBS, twice. All the flow cytometric experiments were executed at a cell density of 2 × 10⁷ cells ml−1 in PBS or medium. The sample (chassis or PTE) was added at a final concentration of 1 nM and incubated for the different time points. Before flow cytometric analysis, the cells were centrifuged for 5 min at 500×g and resuspended to a final cell concentration of 2 × 10⁶ cells ml−1 in PBS. Flow cytometric analysis was performed on a Cytoflex (Beckman Coulter) or Attune Nxt (Thermo Fisher), measuring the fluorescent intensity by excitation at 640 nm and band-pass filter detection at 660/20 nm. The single cells were gated based on the forward scatter versus side scatter. For each measurement, fluorescent intensities of 50,000 individual cells were analysed with an in-house MATLAB (R2021b) script.
T-cell activation assay
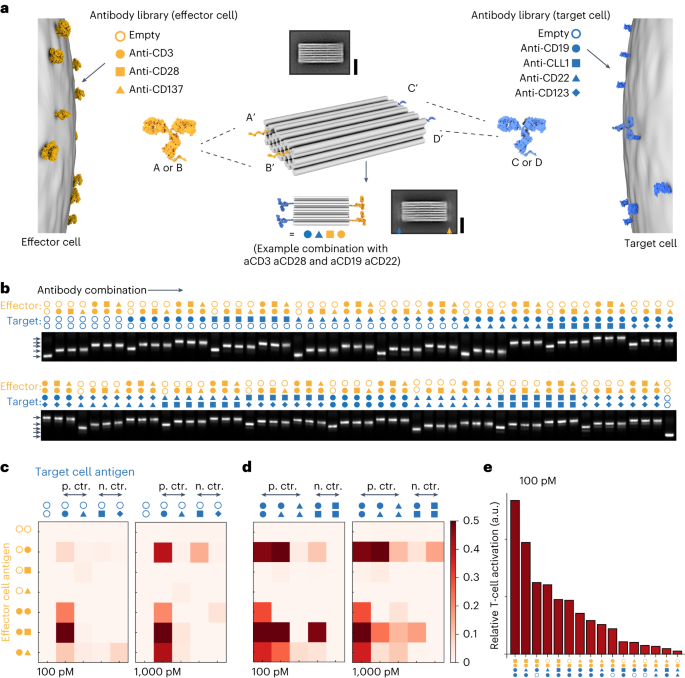
The expression of interleukin 2, as an indicator for T-cell activation, was analysed using T-Cell Activation Bioassays (Promega, J1655)35. The experiment was performed according to the supplier’s instructions. Briefly, CD19-expressing target cells (NALM-6) were added to 96-well microtiter plates at a final concentration of 5 × 10⁵ cells ml−1. Then, a serial dilution of different samples (in RPMI 1640 medium) was added. In the end, the genetically modified TCR/CD3 effector cells were added at a final concentration of 1.3 × 10⁶ cells ml−1. The reaction mixture was incubated for 6 h at 37 °C and 5% CO2. The genetically modified effector cells (Jurkat-NFAT) intercellularly express a luciferase if the interleukin 2 promoter is activated. By the addition of the Bio-Glo reagent, which includes a substrate for the luciferase, the luminescence signal is a direct proportional signal for the activation of the TCR/CD3 effector cells, which was analysed in a microtiter plate reader (Clariostar Plus, BMG). Data were normalized and the background signal was corrected.
Internalization assay
The internalization assay was performed according to another work55. Each DNA origami brick (chassis) carried a fluorescence internalization probe (FIP) comprising a protruding sequence with a terminal-attached Cy5 dye (Supplementary Fig. 4, right inset). This FIP can be quenched using a quenching strand with a complementary sequence to the FIP and an attached Black Hole Quencher-2. On hybridization, Black Hole Quencher-2 quenches the fluorescence of the FIP. Since the quencher strand can only reach the chassis on the cell surface, and not the internalized chassis, the amount of quenched signal is proportional to the amount of surface-exposed chassis.
NALM-6 cells (1 × 10⁷ cells ml–1) were incubated with 1 nM chassis for 1 h at 37 °C in the cell culture medium and then washed to remove the excess chassis. After washing, the cells were resuspended in the cell culture medium and incubated at 37 °C. At each time point, a measurement consists of taking a sample and incubating it for 10 min at 4 °C on ice. Half of the sample is incubated without a quencher strand and the other half is incubated with a 100 nM quencher strand. Both samples were incubated for 10 min on ice to allow for quencher hybridization (if added) and to stop internalization. The fraction of the internalized chassis with two anti-CD19 antibodies was calculated from the median fluorescence F as follows.
$$begin{array}{l}{mathrm{{Fraction},{internalized}}}=frac{{F}_{{{mathrm{with}}},{{mathrm{antibodies}}},,{{mathrm{with}}},{mathrm{{quencher}}}}-{F}_{{{mathrm{without}}},{{mathrm{antibodies}}},,{{mathrm{with}}},{{mathrm{quencher}}}}}{{F}_{{{mathrm{with}}},{{mathrm{antibodies}}},,{{mathrm{without}}},{{mathrm{quencher}}}}-{F}_{{{mathrm{without}}},{{mathrm{antibodies}}},,{{mathrm{without}}},{{mathrm{quencher}}}}}end{array}$$
Cytotoxic T-cell-killing assay of liquid tumour cells
Preparation of target cells
Target cells (for example, NALM-6) were fluorescently stained using CellTrace CSFE Cell Proliferation Kit (Thermo Fisher, C34554) according to the manufacturer’s protocol.
Preparation of PBMC (effector)
For the cytotoxic T-cell-killing assay, we used frozen human PBMC (STEMCELL, 70025.1 or CTL, CTL-UP1). We handled the PBMC cells according to the supplier’s instruction.
Assay
Here 2 × 10⁵ CSFE-stained target cells per millilitre were incubated with 1 × 10⁶ PBMC ml–1 in the cell culture medium at 37 °C (5% CO2) and the PTEs in different concentrations or without an additional recruiter. Cell fluorescence and scattering intensity were determined using an Attune Nxt flow cytometry with a Cytkick Max autosampler (Thermo Fisher). Residual contaminations, such as salts or endotoxins may cause the non-specific lysis of target cells. These effects are particularly pronounced at high PTE concentrations and depend on the cell type.
Cytotoxic T-cell-killing assay of solid tumour cells
Preparation of target cells: target cells (for example, MCF-7) were seeded 24 h in advance to from a confluent monolayer.
Preparation of PBMC (effector): for the cytotoxic T-cell-killing assay, we used frozen human PBMC (STEMCELL, 70025.1 or CTL, CTL-UP1). We handled the PBMC cells according to the supplier’s instruction.
Assay: confluent target cells were incubated with PBMC (E:T 2:1 or 4:1) in cell culture medium at 37 °C (5% CO2) and the PTEs in different concentrations or without an additional recruiter. The fraction of alive target cells was determined by quantifying the amount of ATP after 48 h via Bio-Glo Cell Titer System (Promega) of samples with and without PTEs. Residual contaminations, such as salts or endotoxins, may cause the non-specific lysis of target cells. These effects are particularly pronounced at high PTE concentrations and depend on the cell type.
In vivo animal models
Endotoxin determination of in vivo ready constructs
The endotoxin concentration was measured with a Charles River nexgen-PTS150 V10.2.3 instrument. We used cartridges with a range between 5.00 and 0.05 EU ml–1. The samples were diluted 25-fold to fit into the sensitive range of the cartridges. The endotoxin threshold level for mouse studies was set to 36 EU ml–1. This value is in accordance with the specifications given by the FDA42.
|
Sample |
EU measured |
EU in sample (25-fold) |
QC passed |
|---|---|---|---|
|
1-0 (origami) |
0.068 |
1.7 |
Yes |
|
0-2 (origami) |
0.068 |
1.7 |
Yes |
|
1-2 (origami) |
0.083 |
2.0 |
Yes |
In vivo mouse experiments
Approval for all the animal experiments was granted by the local regulatory authorities (Regierung von Oberbayern).
NOD.Cg-Prkdcscid Il2rgtm1WjI/SzJ (NSG) were purchased from Janvier or bred in-house. NSG mice carry a mutation in the Pkrdc DNA repair gene, associated with severe combined immunodeficiency, leading to a T- and B-cell deficiency. The complete null allele of the IL-2 receptor gamma chain (ll2rg) abrogates the cytokine signalling of critical homoeostatic cytokines such as IL-2, IL-4, IL-7, IL-9 and IL-15, preventing the development of functional NK cells. Finally, the NOD background further compromises the innate branch of the immune system (reduced functionality of dendritic cells and macrophages). In general, these highly immunodeficient mice support stable and reproducible engraftment of human tumour and T cells in mice and are currently regarded as the state-of-the-art model for human xenograft models in mice56,57,58.
All the animals were housed in specific pathogen-free facilities.
BLI and fluorescence imaging were carried out using the in vivo imaging platform Lumina X5 (IVIS, PerkinElmer), as previously described59. In brief, mice were anaesthetized with a 1.5–2.5% isoflurane–oxygen mixture for all the live-imaging procedures. For BLI, the substrate (Xenolight d-luciferin potassium salt, PerkinElmer) was intraperitoneally injected according to the manufacturer’s instructions. For organ analysis, the background fluorescence of each organ was subtracted.
NALM-6-luc+-GFP+ xenograft models were established by i.v. tail-vein injection.
No data points (mice) were excluded in the animal studies.
Flow cytometry for in vivo experiments
Flow cytometric data were generated using a BD LSRFortessa II, a Beckman Coulter CytoFLEX LX or a Thermo Fisher Attune Nxt with an autoloader. Flow cytometric analysis of organs was conducted as previously reported60. Single-cell suspensions of harvested organs were stained with human anti-CD3 BV711 (clone, OKT3), anti-CD4 PerCP-Cy5.5 (clone, OKT4), anti-CD8 PE (clone, HIT8a), anti-CD19 BV786 (clone, HIB19) and anti-CD69 PE-Cy7 (clone, FN50) or mouse anti-CD45 pacific blue (clone, 30-F11) antibodies (Biolegend). Fixable viability dye (eFluor 780, eBioscience) was used to exclude the dead cells. The maximum tumour burden permitted by the local regulatory authorities was not exceeded.
Software and statistical analyses
Flow cytometric data were analysed using FlowJo v. 10.3 to v. 10.8.1 software. Quantifying bioluminescence and fluorescence intensities was done using Living Image 4.4 (PerkinElmer). Statistical analysis was carried out with GraphPad Prism v. 9.4.0. Power calculations (for in vivo experiments) were carried using G*Power 3.1 with given alpha, power and effect size.
Statistics and reproducibility
Statistics and reproducibility are stated in the legend of the figures, for example, biological or technical replicates. Agarose gel images shown in the figures are representative examples of experiments that yielded the same or similar results. For TEM analysis: the total number of similarly conducted TEM analysis of samples prepared following the same protocols varied between experiments—in case of replicates, reproducibility was observed.
Reporting summary
Further information on research design is available in the Nature Portfolio Reporting Summary linked to this article.
- SEO Powered Content & PR Distribution. Get Amplified Today.
- PlatoData.Network Vertical Generative Ai. Empower Yourself. Access Here.
- PlatoAiStream. Web3 Intelligence. Knowledge Amplified. Access Here.
- PlatoESG. Automotive / EVs, Carbon, CleanTech, Energy, Environment, Solar, Waste Management. Access Here.
- PlatoHealth. Biotech and Clinical Trials Intelligence. Access Here.
- ChartPrime. Elevate your Trading Game with ChartPrime. Access Here.
- BlockOffsets. Modernizing Environmental Offset Ownership. Access Here.
- Source: https://www.nature.com/articles/s41565-023-01471-7
- :is
- :not
- :where
- ][p
- $UP
- 000
- 1
- 1.3
- 10
- 100
- 10K
- 116
- 125
- 13
- 15%
- 2%
- 20
- 200
- 2005
- 2008
- 2009
- 2010
- 2013
- 2014
- 2015
- 2016
- 2017
- 2019
- 2021
- 22
- 24
- 25
- 30
- 31
- 36
- 49
- 4k
- 50
- 51
- 60
- 7
- 70
- 8
- 9
- a
- accordance
- According
- acquiring
- acquisition
- activated
- Activation
- activity
- added
- addition
- Additional
- Adobe
- Adult
- advance
- After
- agents
- AL
- All
- allow
- Alpha
- alternative
- amount
- an
- analysis
- Anchor
- and
- animal
- animals
- Another
- Antibodies
- antibody
- approval
- ARE
- armed
- around
- article
- AS
- associated
- At
- attached
- Authentication
- Authorities
- available
- averaging
- avoid
- background
- BAND
- based
- BD
- BE
- been
- before
- below
- between
- bias
- binding
- Black
- Black Hole
- blood
- Blue
- board
- bond
- both
- Box
- Branch
- Bred
- briefly
- buffer
- burden
- by
- calculated
- CAN
- Cancer
- carried
- carry
- case
- Cause
- cell
- Cells
- chain
- change
- Charles
- chassis
- checked
- chemicals
- click
- combination
- combined
- comparison
- complementary
- complete
- comply
- comprising
- concentration
- conditions
- conducted
- Confluent
- consists
- contained
- contrast
- corrected
- Corresponding
- critical
- Culture
- Currently
- cytokine
- cytokines
- data
- data points
- dead
- dense
- density
- described
- Design
- Detection
- determination
- determined
- Development
- device
- Devices
- different
- dilution
- direct
- Disruption
- dna
- done
- dynamic
- e
- E&T
- each
- effect
- effector
- effects
- enable
- end
- Engineering
- enhance
- equivalents
- established
- Ether (ETH)
- ethical
- EU
- example
- examples
- exceeded
- excess
- exchange
- excluded
- executed
- experiment
- experimental
- experiments
- express
- expressed
- expression
- facilities
- fc
- Fig
- Figures
- filter
- filters
- final
- Finally
- fit
- flow
- following
- follows
- For
- forth
- Forward
- fraction
- Free
- from
- frozen
- functional
- functionality
- further
- gated
- ge
- GE Healthcare
- General
- generated
- generation
- given
- gradients
- granted
- grown
- Half
- handled
- Have
- healthcare
- High
- highly
- Hole
- How
- HTTPS
- human
- i
- ICE
- identical
- if
- ii
- image
- images
- Imaging
- immersed
- immune
- Immune system
- immunotherapies
- immunotherapy
- improved
- in
- included
- includes
- Including
- incubated
- Incubating
- INCUBATION
- incubator
- Indicator
- individual
- information
- innate
- Institutional
- instructions
- instrument
- interleukin
- into
- IT
- kit
- Lane
- laser
- leading
- Level
- limits
- Line
- lines
- LINK
- linked
- Liquid
- live
- Liver
- living
- local
- lumina
- macrophages
- make
- manual
- Martin
- material
- max
- maximum
- May..
- measured
- measurement
- measurements
- measuring
- medical
- medium
- mentioned
- method
- mice
- Microscope
- Microscopy
- min
- mixed
- Mixing
- mixture
- MJ
- model
- models
- modified
- modular
- Mutation
- nano
- nanotechnology
- Nature
- NIH
- NK
- no
- now
- number
- nxt
- objects
- observed
- obtained
- of
- on
- only
- or
- Origin
- Other
- otherwise
- our
- out
- over
- overnight
- P&E
- Pacific
- particularly
- PBS
- Peak
- Peg
- per
- performed
- photoshop
- pierce
- Pixel
- platform
- plato
- Plato Data Intelligence
- PlatoData
- plus
- Point
- points
- Polymers
- portfolio
- power
- preclinical
- precursor
- preparation
- prepared
- presence
- preventing
- previously
- probe
- procedures
- Produced
- Products
- Profile
- profiling
- pronounced
- Protein
- Proteins
- protocol
- protocols
- pte
- purchased
- R
- Ramp
- Ramps
- range
- ratios
- reach
- reaction
- reactions
- Reader
- ready
- Reduced
- reducing
- reference
- regarded
- regulations
- regulatory
- remove
- Removed
- repair
- repeat
- replicates
- Reporting
- representative
- research
- Resolution
- respective
- resulting
- Results
- review
- right
- River
- Room
- rt
- s
- salt
- same
- scalable
- SCI
- Science
- sensitive
- Sequence
- serial
- Services
- set
- severe
- Short
- shown
- Shows
- side
- Signal
- similar
- Similarly
- since
- single
- Sites
- Size
- sodium
- Software
- solid
- solution
- Solutions
- specific
- specifications
- specified
- stable
- state-of-the-art
- stated
- statistical
- Stem
- stem cells
- Stop
- stored
- Strains
- Strands
- strategies
- strong
- studies
- Study
- subsequent
- Subsequently
- successful
- such
- support
- Surface
- Suspensions
- synthetic
- system
- T
- T cells
- table
- taking
- Tandem
- Target
- Technical
- that
- The
- then
- therapy
- therapy platform
- thermal
- These
- this
- threshold
- throughout
- time
- to
- Total
- towards
- tumor
- tumours
- Twice
- two
- type
- use
- used
- using
- value
- Values
- verify
- Versus
- via
- viability
- vivo
- Voltage
- von
- was
- washing
- Water
- we
- were
- which
- with
- within
- without
- Work
- yielded
- zephyrnet