- Stellar lumen price started a fresh decline from well above the $0.1900 zone against the US Dollar.
- XLM price is now trading near $0.1800 and the 55 simple moving average (4-hours).
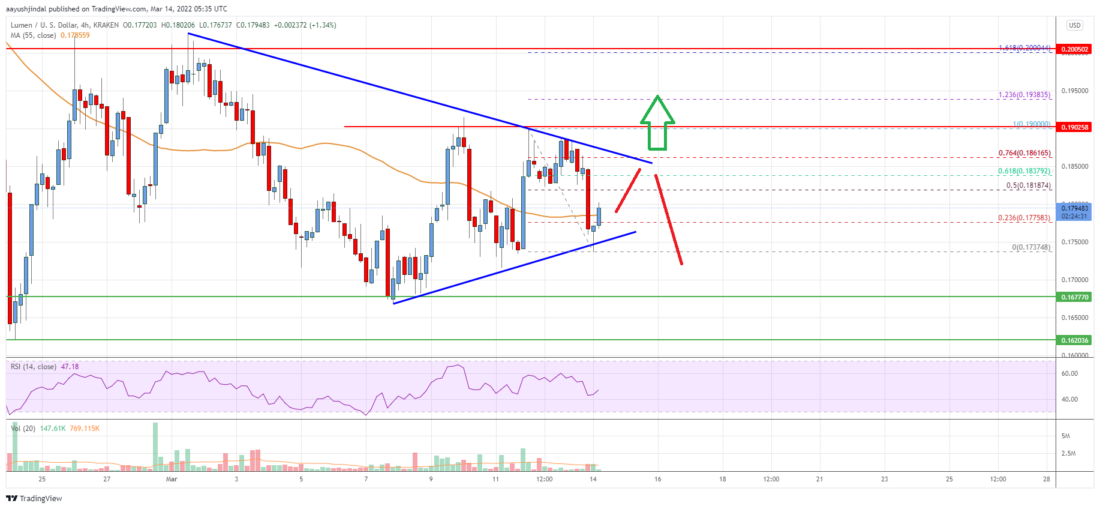
- There is a crucial contracting triangle forming with resistance near $0.1850 on the 4-hours chart (data feed via Kraken).
- The pair could continue to decline if there is a clear move below $0.1750.
Stellar lumen price is trading in a bearish zone below $0.1900 against the US Dollar, similar to bitcoin. XLM price must stay above $0.1750 to avoid more losses.
Stellar Lumen Price Analysis (XLM to USD)
In the past few sessions, stellar lumen price saw a fresh decline from well above $0.1900 against the US Dollar. The XLM/USD pair declined below the $0.1850 support to enter a bearish zone.
There was a move below the $0.1820 and $0.1800 support levels. A low is formed near $0.1737 and the price is now consolidating losses. It is near $0.1800 and the 55 simple moving average (4-hours). An immediate resistance is near the $0.1820 level.
The 50% Fib retracement level of the recent decline from the $0.1900 swing high to $0.1737 swing low is also near the $0.1820 zone. The next key resistance is near the $0.1850 level.
There is also a crucial contracting triangle forming with resistance near $0.1850 on the 4-hours chart. The triangle resistance is near the 76.4% Fib retracement level of the recent decline from the $0.1900 swing high to $0.1737 swing low.
Any more gains could lead the price towards the $0.2000 level. A close above $0.2000 could open the doors for a decent increase. If not, the price might extend losses below $0.1780.
An immediate support on the downside is near the $0.1765 level. The next major support is near the $0.1750 level. Any more losses could lead the price towards the $0.1620 level, where the bulls might take a stand. If they fail, the price may perhaps decline towards the $0.1500 support zone.

Stellar Lumen (XLM) Price
The chart indicates that XLM price is now trading near $0.1800 and the 55 simple moving average (4-hours). Overall, the price could continue to decline if there is a clear move below $0.1750 in the near term.
Technical Indicators
4 hours MACD – The MACD for XLM/USD is slowly gaining momentum in the bullish zone.
4 hours RSI – The RSI for XLM/USD is now just below the 50 level.
Key Support Levels – $0.1750 and $0.1620.
Key Resistance Levels – $0.1800, $0.1850 and $0.2000.
The post Stellar Lumen (XLM) Price Near Make-or-Break Levels appeared first on Live Bitcoin News.