SNEAK PEEK
- SNX market shows solid bullish momentum, with potential for further gains.
- Short-term momentum outweighs long-term momentum, presenting a buying opportunity.
- Traders are advised to monitor market volatility and RSI readings for a potential correction.
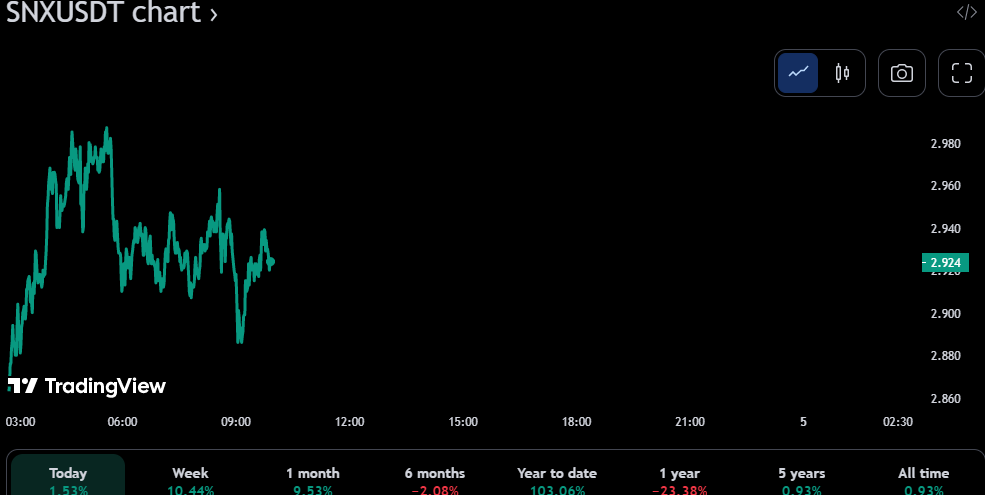
Bullish enthusiasm has managed to value the price between an intra-day high of $2.98 and an intra-day low of $2.64 in the Synthetix (SNX) market during the previous 24 hours. As of press time, SNX was trading at $2.93, representing a 10.90% gain over its last close.
Due to bullish control, the market capitalization and 24-hour trading volume increased by 10.92% and 19.39%, respectively, demonstrating investors’ rising confidence in the market. Nonetheless, market volatility is unavoidable; therefore, keeping a constant eye on the situation is critical.
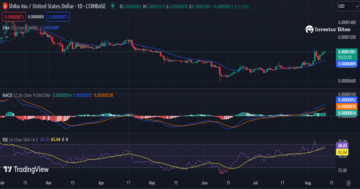
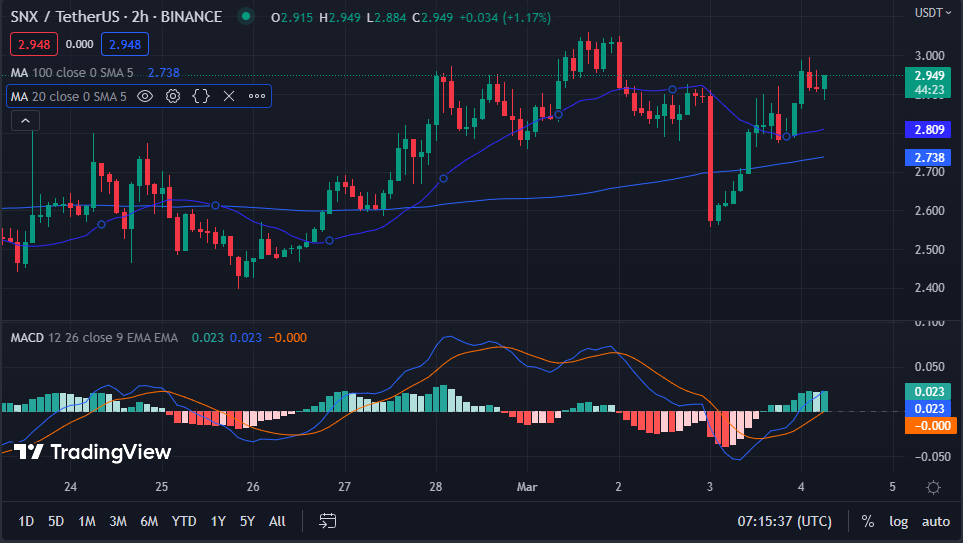
The SNX price chart shows a bullish crossover, with the 20-day MA at 2.868 and the 100-day MA at 2.679. This movement indicates that the SNX price’s short-term momentum outweighs its long-term momentum. Traders may consider this as a good buying opportunity for SNX. As the price movement is above both MAs, the positive rate in SNX is expected to continue, suggesting a probable rise soon.
The blue MACD line on the 2-hour price chart goes above its signal line into the positive area, with a value of 0.222, indicating that buyers are gaining power in the market. This move adds to the probable upswing in the SNX and boosts the positive feeling among traders and investors.
Histogram readings above zero indicate buyers remain confident in driving SNX’s price upward. Traders may contemplate retaining or adding to their holdings in expectation of more gains.
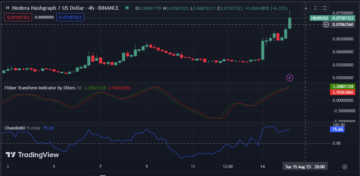
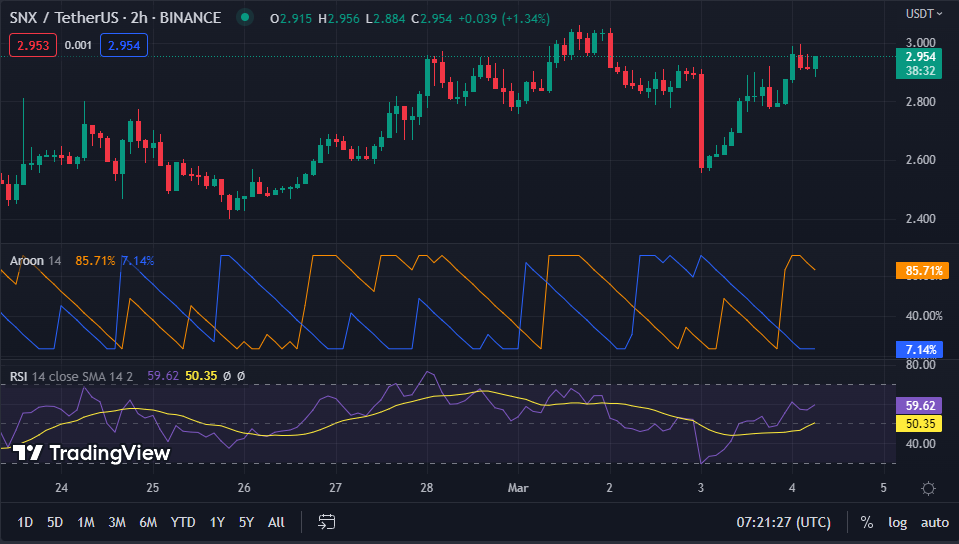
The SYX market’s Aroon up reading of 85.71% and Aroon down reading of 7.14% indicates that bullish momentum is strong and expected to persist soon. To capitalize on possible profits, traders may consider taking long positions or holding onto current ones. Conversely, a trend reversal might occur if the Aroon down reading exceeds the Aroon up reading.
With a Relative Strength Index (RSI) reading of 59.42, the market’s bullish energy remains, but care is advised as it approaches overbought territory. If the RSI reading rises over 70, it may indicate that the market has become overbought and that a correction is imminent.
Bullish sentiment and technical indicators suggest potential gains for SNX, but traders should monitor for volatility and overbought conditions.
Disclaimer: In good faith, we disclose our thoughts and opinions in our price analysis and all the facts we give. Each reader is responsible for his or her own investigation. Reader discretion is advised before taking any action.
- SEO Powered Content & PR Distribution. Get Amplified Today.
- Platoblockchain. Web3 Metaverse Intelligence. Knowledge Amplified. Access Here.
- Source: https://investorbites.com/synthetix-snx-price-analysis-3-4/
- 10
- 7
- 70
- 98
- a
- above
- Action
- Adds
- All
- Amid
- among
- analysis
- and
- approaches
- AREA
- become
- before
- between
- Blue
- Bullish
- buyers
- Buying
- capitalization
- capitalize
- care
- Chart
- Close
- conditions
- confidence
- confident
- Consider
- constant
- continue
- control
- critical
- Current
- demonstrating
- Disclose
- discretion
- down
- driving
- during
- each
- energy
- enthusiasm
- exceeds
- expectation
- expected
- eye
- faith
- further
- Gain
- gaining
- Gains
- Give
- Goes
- good
- High
- holding
- Holdings
- HOURS
- HTTPS
- important
- in
- increased
- index
- indicate
- indicates
- Indicators
- internal
- investigation
- Investors
- IT
- keeping
- Last
- Line
- Long
- long-term
- Low
- MACD
- managed
- Market
- Market Capitalization
- Market News
- MAS
- might
- Momentum
- Monitor
- more
- move
- movement
- news
- Opinions
- Opportunity
- own
- plato
- Plato Data Intelligence
- PlatoData
- positions
- positive
- possible
- potential
- power
- press
- previous
- price
- Price Analysis
- price chart
- price upward
- profits
- Rate
- Reader
- Reading
- relative strength index
- Relative Strength Index (RSI)
- remain
- remains
- representing
- responsible
- retaining
- Revealed
- Reversal
- Rise
- Rises
- rising
- rsi
- sentiment
- short-term
- should
- Shows
- Signal
- situation
- SNX
- solid
- Soon
- Source
- stablecoin
- strength
- strong
- Synthetix
- Synthetix (SNX)
- taking
- Technical
- The
- their
- therefore
- time
- to
- Traders
- Trading
- trading volume
- TradingView
- Trend
- upward
- value
- Volatility
- volume
- What
- What is
- zephyrnet
- zero