Reagents
The following reagents were used: horse heart Cyt c (C7752, Sigma-Aldrich), EDC (E6383, Sigma-Aldrich), NHS (130672, Sigma-Aldrich), 2-(N-morpholino)ethane sulfonic acid hydrate, 4-morpholineethanesulfonic acid (M8250, Sigma-Aldrich), l-ascorbic acid (A92902, Sigma-Aldrich), μ-plate 24-well black ibiTreat surface (IB-82426, Thistle Scientific), Hoechst 33342 (NucBlue Live ReadyProbes Reagent, R37605, Thermo Fisher Scientific), actin using Phalloidin–iFluor 488 conjugate (23115, AAT Bioquest, Stratech), PrestoBlue HS cell viability reagent (P50200, Invitrogen), calcein AM (C1430, Thermo Fisher Scientific), propidium iodide (P4170, Sigma-Aldrich), H2DCFDA (D399, Invitrogen), CellEvent Caspase-3/7 Green Flow Cytometry Assay Kit (C10427, Invitrogen), Zombie NIR Fixable Viability Kit (423105, BioLegend), CellEvent Caspase-3/7 Green ReadyProbes Reagent (R37111, Invitrogen), CellLight Late Endosomes-GFP, BacMam 2.0 (C10588, Thermo Fisher Scientific) and LysoTracker Green DND-26 (L7526, Thermo Fisher Scientific). A catalogue number is not available for the carboxylic-PEG-coated GNPs or Z as they were customized and purchased from Nanopartz and Porphychem, respectively.
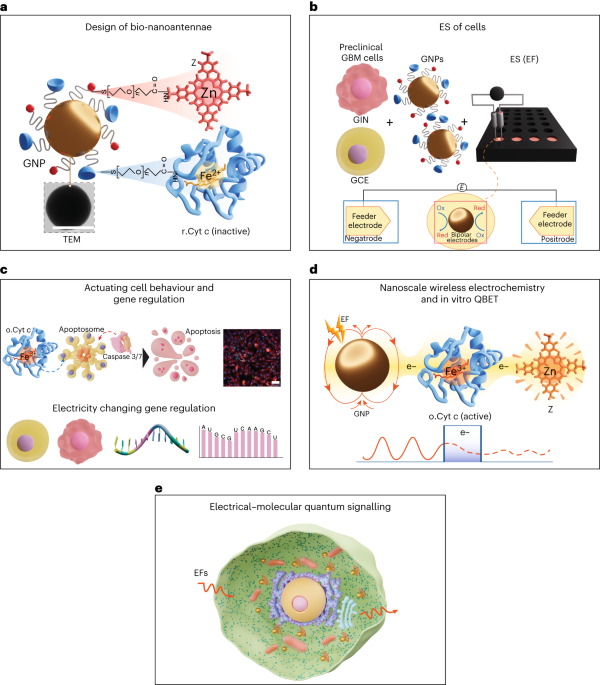
Synthesis of bifunctionalized gold bipolar bio-nanoantennae
Spherical GNPs with a diameter (d) of 100 nm and capped with thiol-carboxylic-PEG (SH-PEG-COOH; molecular weight M = 1 kDa, 2 kDa, 3.5 kDa and 5 kDa) with a PEG density of 1–1.5 nm2 were purchased from Nanopartz. The r.Cyt c was obtained by adding 10 mg of the oxidized form of the horse heart Cyt c (o.Cyt c) into 5 mL l-ascorbic acid solution (1 mg mL–1 in PBS) and purifying by dialysis at 4 °C in dark conditions for 36 h to remove excess ascorbic acid. The r.Cyt c and Z were covalently conjugated to a carboxylic group on the capping ligands of GNPs using EDC/NHS carbodiimide coupling chemistry. Briefly, 20 μL GNP solution (3.6 mg mL–1 in ultrapure water) was mixed with 20 μL EDC/NHS solution in 2-(N-morpholino)ethane sulfonic acid buffer (10 mM, pH 5.5) at a concentration of 30 and 36 mg mL–1. The solution was mixed for 1 h at room temperature; then 1 mL of washing buffer (×1 PBS with 0.01% (w/v) Tween 20) was added, and the solution was centrifuged at 450g for 20 min. The supernatant was discarded and 20 μL r.Cyt c (1 mg mL–1) and Z (0.5 mg mL–1) were added to the pellet and sonicated using a Fisherbrand ultrasonic bath (FB11201, 80 KHz, 50% power, 1 min). Next, the solution was incubated for 4 h at room temperature under mixing; then 1 mL washing buffer was added, and the solution was centrifuged at 450g for 20 min. To ensure the complete removal of unbound r.Cyt c and Z, the washing step was repeated twice. The obtained pellet consist of GNPs conjugated with r.Cyt c and Z (GNP100@r.Cyt c@Z) was dispersed in PBS and stored at 4 °C until further use.
To prepare the control samples of GNPs covalently conjugated with only one molecule, either r.Cyt c (GNP100@r.Cyt c) or Z (GNP100@Z), only one of these compounds was introduced during the EDC/NHS step with concentrations of 0.25 mg mL–1 or 0.1 mg mL–1, respectively. The same protocol was used to synthesize bio-nanoantennae with different GNP diameters (20 nm, 50 nm and 100 nm) and different PEG lengths (1 kDa, 2 kDa, 3.5 kDa, 5 kDa). The concentration of Cyt c and Z during the EDC/NHS step was optimized (0.25, 0.5 and 1 mg mL–1) to obtain a similar binding ratio of Cyt c and Z per GNP.
Characterization techniques
Dynamic light scattering and zeta potential measurements
The hydrodynamic diameter (hd) and zeta potential (ζ) of bio-nanoantennae (in ultrapure water) was measured using a Malvern Zetasizer Nano-ZS ((Malvern Instruments).
Transmission electron microscopy
A TEM instrument (JEOL 2000 FX TEM) operating at 200 kV accelerating voltage was used to record TEM images. The samples were prepared by drop-casting 10 μL of sample onto a carbon-coated copper grid (400 Mesh, Agar Scientific) twice in an interval of 1 h. The sample was dried for at least 30 min before TEM imaging.
UV–visible absorption spectroscopy
UV–visible absorption spectra of bio-nanoantennae dispersed in PBS were recorded on a Cary 3500 UV–visible instrument (Agilent Technologies).
Circular dichroism
Far- and near-UV circular dichroism spectra were recorded at 20 °C on a Chirascan circular dichroism spectrophotometer (Applied Photophysics) equipped with a temperature control unit TC125 (Quantum Northwest). Samples were dispersed in 10 mM PBS at pH 7.4. At least three spectra were recorded for each sample and averaged. A quartz cuvette with an optical path length of 1 cm was used for the circular dichroism measurements.
Cyclic voltammetry
The electrochemical analyses were conducted using a Metrohm Autolab M204 potentiostat equipped with a three-electrode system consisting of a platinum wire counter electrode, an Ag/AgCl reference electrode and an ITO working electrode (Delta Technologies). ITO-coated glass (10 mm × 20 mm) was washed with acetone and water, dried with argon and assembled into an electrochemical cell with an exposed working area of 38.5 mm2. Bifunctionalized gold bipolar nanoelectrodes were dispersed in PBS to a final concentration of 25 μg mL–1 (determined using UV–visible spectroscopy). Cyclic voltammetry was conducted between 1.2 V and −0.2 V with varying scan rates between 50 mV s−1 and 2 V s−1. Repetitive consecutive cyclic voltammetry measurements were conducted at a fixed scan rate of 100 mV s−1. Control cyclic voltammetry measurements were conducted with carboxylic-PEG-modified GNPs using PBS as the supporting electrolyte.
The heterogeneous rate constant (k0) was calculated using the Nicholson and Shain method46. The rate transfer coefficient, α, was calculated from the scan rate study (Supplementary Fig. 5). The slope of the logarithm of the scan rate versus the difference between the peak potential and formal potential of the cell is given by equation (2):
$${rm{Slope}}=-frac{2.3,{RT}}{alpha {nF}}$$
(2)
where R is the gas constant, T is temperature, n is the number of electrons transferred in the redox reaction and F is the Faraday constant.
However, the Nicholson and Shain method for determining ψ (ψ is a function of the peak separation) assumes that α = 0.5. But in this work, the value of α is different (Supplementary Table 5); therefore, the Lavagnini method47 is used to calculate ψ as the function of the peak separation ΔEp using equation (3):
$$psi =2.18{left(frac{alpha }{uppi }right)}^{0.5}{{exp }}left[right.-left(frac{{alpha }^{2}F}{{RT}}right)nDelta {E}_{mathrm{{p}}}.$$
(3)
Then k0 for the nanoantennae is calculated using equation (4):
$$psi ={k}^{0}{left[frac{{{uppi }}{{D}}{nv}{{F}}}{{{RT}}}right]}^{-0.5}$$
(4)
where D is the diffusion coefficient.
Cell lines
GIN cells were isolated from the 5-aminolevulinic acid (5-ALA) fluorescing infiltrative tumour margin, and GCE cells were isolated from the core central region of the tumour, from GBM patients who underwent surgery at the Queen’s Medical Centre, University of Nottingham (Nottingham, UK), using a previously described method29. Low-passage U251 cell lines (purchased from ATCC) and patient-derived GIN 28, GIN 31, GCE 28 and GCE 31 cells were cultured in DMEM medium (Gibco) supplemented with 10% foetal bovine serum (FBS), 1% penicillin/streptomycin and 1% l-glutamine. Human-derived cortical astrocytes (HCOA; catalogue no. 1800, batch no. 24490, ScienCell) and cerebellar astrocytes (HCEA; catalogue no. 1810, ScienCell) were cultured in astrocyte medium containing 2% FBS, 1% astrocyte growth supplement and 1% penicillin/streptomycin from ScienCell. The human intrahepatic biliary epithelial cells (HIBEpiC) isolated from healthy human liver tissue were acquired from Innoprot (P10654) and cultured in epithelial basal medium containing 2% FBS, 1% epithelial cell growth supplement and 1% penicillin/streptomycin. All cells were maintained at 37 °C in an incubator with a humidified atmosphere, containing 5% CO2. Cells were routinely tested for mycoplasma (once a month), and they were grown in an antibiotic-free medium for one week before mycoplasma testing. All cells used were mycoplasma-free.
PrestoBlue HS assay for biocompatibility and metabolic activity studies
The cells (U251, HCOA, GIN and GCE) were seeded in a 96-well plate at a density of 5 × 10³ cells per well and allowed to adhere for 24 h. The medium was replaced with fresh medium containing GNP conjugates at different concentrations (25, 50 and 100 μg mL–1), and the cells were incubated for 8 h. The medium was removed, and the cells were washed with PBS and incubated for another 48 h in fresh medium. The medium was replaced with a complete medium containing 10% PrestoBlue HS cell viability reagent and incubated for an hour before reading the fluorescence at 590 nm and 610 nm (excitation and emission) in a Tecan microplate reader (Infinite M Plex and Spark 10M). Cells grown in culture media provided only the negative control. Values are presented relative to the negative control. The data are represented as an average of a triplicate experiment with three independent repeats.
Cellular association using ICP-MS and uptake using confocal microscopy
GIN and GCE cells were seeded into a 24-well plate at a density of 1 × 10⁵ cells per well and incubated at 37 °C for 24 h. After 24 h, the culture medium was replaced with fresh medium containing 25 μg mL–1 of GNP100@r.Cyt c@Z and incubated for 8 h. Then the medium was removed, and the cells were washed with PBS (300 μL, repeated two times). The cells were trypsinized, and 50 μL of cell suspension was used for trypan blue cell viability and counting. The remaining cell suspension was centrifuged at 300g for 5 min. The obtained cell pellet was digested overnight with 70% nitric acid, diluted with Milli-Q water to bring the acid concentration to 2% and used for ICP-MS analysis (iCAPQ, Thermo Fischer).
To confirm the cellular uptake of the bipolar nanoelectrode, after 8 h exposure, the cells were washed with PBS (300 μL, two times), fixed with 4% paraformaldehyde for 15 min and washed twice with PBS. The cell nuclei were stained with Hoechst 33342 and actin using Phalloidin–iFluor 488 conjugate and incubated for 1 h at 37 °C in the dark. After washing the cells twice and immersing them in PBS, the fluorescence imaging was performed using a Leica TCS SPE confocal microscope. The orthogonal sections of z stacks were obtained, and the images were analysed using ImageJ.
Electrical stimulation studies
U251, HIBEpiC, GIN 28, GIN 31, GCE 28 and GCE 31 cells were seeded in a 24-well plate (μ-plate 24-well black ibiTreat, Thistle Scientific) at a density of 7.5 × 10⁴ cells per well, while HCOA and HCEA were seeded at a density of 5 × 10⁴ cells per well in a poly-l-lysine-coated 24-well plate. The cells were incubated for 24 h at 37 °C and 5% CO2, and then the cell culture medium was replaced with fresh medium containing bio-nanoantennae (25 μg mL–1) and incubated for 8 h. The cells were washed twice with PBS. Two steel electrodes (0.5 mm × 25 mm) were placed at a fixed distance (at opposite sides of the well and 10 mm from each other) in each well of a 24-well plate and dipped in cell culture medium. The electrodes were connected to an arbitrary function generator (AFG-21225, RS PRO) to deliver the required a.c. sine-wave signals, frequency and amplitude. The cells were stimulated with a.c. EFs with a frequency of 3 MHz and a peak voltage amplitude of 0.65 V cm–1 for a period of 2 h or 12 h. The EF between the electrodes was measured using a digital oscilloscope (TDS 210, Tektronix), and the temperature was monitored every 2 h using an infrared laser gun (IR-801, ATP). The intensity of the EF is expressed in peak voltage amplitude per centimetre (V cm–1). The metabolic activity of cells after ES was analyzed using a PrestoBlue HS assay.
Calcein AM and propidium iodide live–dead assay
Immediately after the ES, the medium was removed and replaced with fresh medium containing mixed dyes 1 μM calcein AM and 1 μg mL−1 propidium iodide, and incubated for 30 min at 37 °C and 5% CO2. The cells were washed twice with PBS, and fresh phenol red free medium was added. The cells were imaged using a Nikon Eclipse Ti fluorescent microscope with GFP and mCherry filter settings. The populations of live and dead cells were quantified using ImageJ software.
H2DCFDA/DCF reactive oxygen species generation assay
The cells were incubated with non-fluorescent cell-permeant 2′,7′-dichlorodihydrofluorescein diacetate (H2DCFDA, 5 μM) probe for 30 min prior to ES. Immediately after the ES, the cells were washed with PBS. The generated reactive oxygen species converted H2DCFDA into 2′,7′-dichlorofluorescein. Green fluorescence of 2′,7′-dichlorofluorescein was detected using a Nikon Eclipse Ti with FITC filter settings.
Caspase 3/7 flow cytometry analysis of cell death
Immediately after the ES, cells were trypsinized and centrifuged (300g for 5 min) to obtain a cell pellet. After washing with PBS, cells were incubated with a dye master mix containing CellEvent Caspase-3/7 Green Detection Reagent (1:1,000) and Zombie NIR fixable viability stain (1:2,500) for 30 min. Then the cells were centrifuged at 300g for 5 min, washed with PBS and fixed with 4% paraformaldehyde. The fluorescence signals of the caspase 3/7 dye (excitation and emission, 511 nm and 523 nm) and Zombie NIR dye (excitation and emission, 719 nm and 746 nm), characteristic for apoptotic and necrotic cell populations, respectively, were detected using a Sony ID7000 spectral flow cytometer. Kaluza software (v.2.1) was used to analyze the data.
Caspase 3/7 detection using confocal microscope
Immediately after the ES, the medium was removed and the cells were incubated with 8 µM CellEvent Caspase-3/7 Green ReadyProbes Reagent in PBS containing 5% FBS for 30 min at 37 °C. Afterwards, the cells were fixed with 4% paraformaldehyde for 20 min and subsequently washed twice with PBS. Later the cells were treated with actin stain Phalloidin–iFluor 594 conjugate for 90 min at 37 °C in the dark and washed again with PBS, followed by staining with Hoechst 33342 for 10 min. Finally, the cells were washed with PBS (twice) and imaged using a Leica TCS SPE confocal microscope with a ×63 objective using the filter settings of Alexa Fluor 488 and Texas Red 594 dyes.
Colocalization studies
GIN and GCE cells were seeded at a density of 4 × 10⁴ cells per well in a 24-well plate and incubated at 37 °C for 24 h. After 24 h, the culture medium was replaced with fresh medium containing CellLight Late Endosomes-GFP, BacMam 2.0 and incubated overnight at 37 °C and 5% CO2. Later, the medium was replaced with fresh medium containing 25 μg mL–1 of GNP100@r.Cyt c@Z and incubated for 8 h. Immediately after the ES, the cells were washed with PBS and imaged using a Leica confocal microscope. For lysosomal staining, immediately after ES, the cells were incubated with medium containing 100 nM LysoTracker Green DND-26 for 30 min followed by washing and imaging.
Gene regulation analysis
Differential gene regulation analysis
Immediately after the ES (3 MHz, 0.65 V cm–1, 2 hours) cells were washed with PBS, trypsinized and centrifuged to obtain a pellet. The cell pellets were snap-frozen in liquid nitrogen for 5 min and stored at −80 °C until shipment (in dry ice) to the Qiagen genomics facility at Hilden, Germany.
Sample preparation
RNA was isolated from 200,000 cells using the RNeasy Micro (Qiagen) according to the manufacturer’s instructions with an elution volume of 14 µL.
Library preparation and sequencing
The library preparation was done using the QIAseq UPX 3′ Transcriptome Kit (Qiagen). A total of 10 ng purified RNA was converted into cDNA Next Generation Sequencing (NGS libraries). During reverse transcription, each cell is tagged with a unique ID and each RNA molecule is tagged with a unique molecular index (UMI). Then the RNA is converted to cDNA (complementary Deoxyribonucleic acid). The cDNA was amplified, the PCR (polymerase chain reaction) indices were added and the libraries were purified. Library preparation was quality controlled using capillary electrophoresis (Agilent DNA 7500 Chip). Based on the quality of the inserts and the concentration measurements, the libraries were pooled in equimolar ratios. The library pool(s) were quantified using qPCR (quantitative polymerase chain reaction). Each library pool was then sequenced on a NextSeq (Illumina) sequencing instrument according to the manufacturer instructions with 100 bp read length for read 1 and 27 bp for read2. Raw data were de-multiplexed, and FASTQ files for each sample were generated using the bcl2fastq2 software (Illumina).
Read demultiplexing, mapping and quantification of gene expression
The ‘Demultiplex QIAseq UPX 3′ reads’ tool of the CLC Genomics Workbench v.20.0.4 was used to de-multiplex the raw sequencing reads according to the sample indices. The ‘Quantify QIAseq UPX 3′ workflow’ was used to process the de-multiplexed sequencing reads with default settings. In short, the reads are annotated with their UMI and are then trimmed for poly(A) and adapter sequences, minimum reads length (15 nucleotides), read quality and ambiguous nucleotides (maximum of 2). They are then deduplicated using their UMI. Reads are grouped into UMI groups when they (1) start at the same position based on the end of the read to which the UMI is ligated (that is, Read2 for paired data), (2) are from the same strand and (3) have identical UMIs. Groups that contain only one read (singletons) are merged into non-singleton groups if the singleton’s UMI can be converted to a UMI of a non-singleton group by introducing an single nucleotide polymorphism (the biggest group is chosen). The reads were then mapped to the human genome hg38 and annotated using the refseq GRCh38.p13 mRNA (messenger Ribonucelic acid) annotation.
The ‘Empirical analysis of DGE’ algorithm of the CLC Genomics Workbench v.21.0.4 was used for differential expression analysis with default settings. It is an implementation of the ‘Exact Test’ for two-group comparisons developed by Robinson and Smyth48 and incorporated in the EdgeR Bioconductor Package (Robinson et al., 2010)49.
For all unsupervised analysis, only genes were considered with at least ten counts summed over all samples. A variance stabilizing transformation was performed on the raw count matrix using the function vst of the R package DESeq2 v.1.28.1. Some 500 genes with the highest variance were used for the principal component analysis. The variance was calculated agnostically to the predefined groups (blind = TRUE). Some 35 genes with the highest variance across samples were selected for hierarchical clustering.
Differential gene expression and gene-set enrichment analysis
To identify differentially expressed genes, we used the linear modelling-based limma algorithm on the transcriptome dataset50. Briefly, we compared differential mRNA expression among the different conditions (treated versus untreated) across the cell lines. The significantly regulated genes were selected with an adjusted P value below 0.05 using the Benjamini–Hochberg correction method for multiple testing. Enrichment analysis of the biological processes was carried out by a gene-set enrichment analysis algorithm51. Briefly, the gene sets were obtained from MSigDB (ref. 52), and enrichment analyses were conducted among the different conditions across cell lines. Normalized enrichment scores, P values and adjusted P values (calculated with a standard Benjamini–Hochberg procedure) were retrieved for each of the gene sets. The gene sets with higher normalized enrichment score values and an adjusted P value < 0.05 were considered as enriched for a specific GBM region.
To identify the cell-line-specific responses to treatment, the top differentially regulated pathways (P value < 0.05) with high normalized enrichment scores across the astrocytic and GBM-derived cell lines were selected.
Mathematical model of metabolic activity, charging rate and quantum tunnelling
We looked to develop a mathematical model to support the characteristic exponential decay connected with quantum mechanics:
$$Ppropto {mathrm{{e}}}^{-alpha r}$$
(5)
where P is the probability of electron tunnelling; α is the inverse localization length, which scales with the energy barrier that an electron must tunnel through; and r is the length of the energy barrier. We define an intrinsic rate of cell death (directly proportional to the probability of a given cell dying within a given time frame), rd, which we assume is proportional to the rate of cytochrome charging. Then, the number of dead cells (D) at time t is
$$Dleft(tright)={int }_{!!0}^{t}{rm{d}}{t}^{{prime} }Aleft({t}^{{prime} }right){r}_{mathrm{{d}}}$$
(6)
where A is the number of alive cells. The metabolic activity is given by
$$Mleft(tright)=frac{A(t)}{A(t)+D(t)}=frac{T-{r}_{mathrm{{d}}}{int }_{!!0}^{t}{rm{d}}{t}^{{prime} }Aleft({t}^{{prime} }right)}{T}$$
(7)
where T = D + A is the total number of cells. Solving the above equation, we find that (Mleft(tright)={{mathrm{e}}}^{-{r}_{{mathrm{d}}}t}.) therefore, the rate of charging at any given time (t) is given by rd ∝ –ln[M(t)].
Dark-field microscopy and plasmon resonance scattering spectroscopy
The plasmon resonance scattering measurements were carried out on an inverted dark-field microscope (eclipse Ti-U, Nikon) using a ×40 objective lens (numerical aperture, 0.6) and a dark-field condenser (0.8 < numerical aperture < 0.95). A halogen lamp (100 W) was used as a source of white light to generate plasmon resonance scattering light. The dark-field images were captured by a true-colour digital camera (Nikon DS-fi). The light scattered from the bifunctionalized nanoantennae was split by a monochromator (grating density, 300 lines mm–1; blazed wavelength, 500 nm; Acton SP2300i, Princeton Instruments). An IsoPlane-320 spectrometer was used, and the split light was collected by a charge-coupled device (Pixis 100BX, Princeton Instruments). An a.c. EF of 3 MHz at 0.65 V was applied for 10 min, and scattering spectra were monitored (1,000 frames recorded). The exposure time was 500 ms. The samples for plasmon resonance scattering were prepared by immobilizing nanoantennae on ITO. First, ITO slides were treatment with ethanol, acetone and water under sonication. Next, 50 µl nanoantennae solution was drop-casted on the ITO slides for 10 min, followed by a single-step washing and rinsing with water. Finally, the slides were dried with N2 gas.
Statistics and reproducibility
All the statistical analyses were performed using GraphPad Prism v.9.4.1 software (GraphPad Software). All the data are expressed as mean ± s.e.m., unless specified. For responses that were affected by two variables, a two-way ANOVA with a Tukey post-test was used. The value P ≤ 0.05 was considered significant. The number of technical replicates and independent repeats is included in the figure legends.
Reporting summary
Further information on research design is available in the Nature Portfolio Reporting Summary linked to this article.
- SEO Powered Content & PR Distribution. Get Amplified Today.
- PlatoData.Network Vertical Generative Ai. Empower Yourself. Access Here.
- PlatoAiStream. Web3 Intelligence. Knowledge Amplified. Access Here.
- PlatoESG. Automotive / EVs, Carbon, CleanTech, Energy, Environment, Solar, Waste Management. Access Here.
- PlatoHealth. Biotech and Clinical Trials Intelligence. Access Here.
- ChartPrime. Elevate your Trading Game with ChartPrime. Access Here.
- BlockOffsets. Modernizing Environmental Offset Ownership. Access Here.
- Source: https://www.nature.com/articles/s41565-023-01496-y
- :is
- :not
- 000
- 1
- 10
- 100
- 102
- 10m
- 12
- 14
- 15%
- 16
- 1800
- 2%
- 20
- 200
- 2000
- 2005
- 2008
- 2010
- 2015
- 2017
- 2020
- 24
- 25
- 26
- 27
- 28
- 29
- 30
- 300
- 31
- 32
- 33
- 36
- 400
- 46
- 49
- 50
- 500
- 51
- 610
- 65
- 7
- 77
- 8
- 80
- 9
- 90
- a
- above
- accelerating
- According
- acquired
- across
- activity
- added
- adding
- adhere
- Adjusted
- After
- afterwards
- again
- AL
- Alexa
- algorithm
- alive
- All
- allowed
- am
- among
- Amplified
- an
- analysis
- analyze
- analyzed
- Anchor
- and
- Another
- any
- applications
- applied
- approach
- ARE
- AREA
- article
- AS
- assembled
- Association
- assume
- assumes
- At
- Atmosphere
- available
- average
- barrier
- based
- BE
- before
- below
- between
- Biggest
- binding
- Black
- blind
- Blue
- BP
- briefly
- bring
- buffer
- but
- by
- calculate
- calculated
- camera
- CAN
- Cancer
- captured
- carried
- cell
- Cells
- cellular
- central
- centre
- chain
- characteristic
- charging
- chemistry
- chip
- chosen
- click
- clustering
- collection
- compared
- complementary
- complete
- component
- concentration
- conditions
- conducted
- Confirm
- connected
- consecutive
- considered
- Consisting
- constant
- contain
- control
- controlled
- converted
- Copper
- Core
- Counter
- counting
- Culture
- customized
- Dark
- data
- Database
- dead
- Death
- Default
- define
- deliver
- Delta
- density
- described
- Design
- detected
- Detection
- determined
- determining
- develop
- developed
- device
- Dialysis
- difference
- different
- Diffusion
- digital
- diluted
- directly
- dispersed
- Dispersion
- distance
- dna
- done
- dry
- during
- Dying
- e
- E&T
- each
- either
- electrolyte
- electrons
- emission
- end
- energy
- enriched
- ensure
- equipped
- Ether (ETH)
- evaluation
- Every
- excess
- experiment
- exponential
- exposed
- Exposure
- expressed
- expression
- Facility
- Fig
- Figure
- Files
- filter
- final
- Finally
- Find
- First
- fixed
- flow
- followed
- following
- For
- form
- formal
- FRAME
- Free
- Frequency
- fresh
- from
- function
- further
- FX
- GAS
- generate
- generated
- generation
- generator
- genome
- genomics
- Germany
- Gin
- given
- glass
- Gold
- Green
- Grid
- Group
- Group’s
- grown
- Growth
- Have
- healthy
- Heart
- High
- higher
- highest
- Horse
- hour
- HOURS
- HTTPS
- human
- human genome
- i
- ICE
- ID
- identical
- identify
- if
- images
- Imaging
- immediately
- immunotherapy
- implementation
- in
- included
- Incorporated
- incubated
- incubator
- independent
- index
- Indices
- induction
- inflammation
- information
- Inserts
- instructions
- instrument
- instruments
- into
- intrinsic
- introduced
- introducing
- invasive
- isolated
- isolation
- IT
- KDA
- kit
- laser
- Late
- later
- least
- Legends
- Length
- Lens
- libraries
- Library
- light
- lines
- LINK
- linked
- Liquid
- live
- Liver
- Localization
- looked
- Manufacturer
- mapping
- Margin
- master
- material
- mathematical
- Matrix
- maximum
- mean
- measured
- measurements
- mechanics
- Media
- medical
- medium
- mesh
- Messenger
- metabolic
- method
- methods
- micro
- Microscope
- Microscopy
- min
- minimum
- mix
- mixed
- Mixing
- ML
- model
- molecular
- molecule
- monitored
- Month
- mRNA
- MS
- multiple
- must
- nanotechnology
- Nature
- negative
- next
- NHS
- no
- number
- objective
- obtain
- obtained
- of
- on
- once
- ONE
- only
- onto
- operating
- opposite
- optical
- optimized
- or
- Other
- out
- over
- overnight
- Oxygen
- package
- paired
- path
- pathways
- patients
- PBS
- PCR
- Peak
- Peg
- per
- performed
- period
- phenotype
- platinum
- plato
- Plato Data Intelligence
- PlatoData
- plex
- pool
- populations
- portfolio
- position
- potential
- power
- Practical
- preparation
- Prepare
- prepared
- presented
- previously
- princeton
- Principal
- Prior
- Pro
- probability
- probe
- PROC
- procedure
- process
- processes
- Profiles
- protocol
- provided
- purchased
- quality
- quantification
- quantitative
- Quantum
- Quantum Mechanics
- R
- Rate
- Rates
- ratio
- ratios
- Raw
- raw data
- reaction
- Read
- Reader
- Reading
- record
- recorded
- Red
- reference
- region
- regulated
- Regulation
- relative
- remaining
- removal
- remove
- Removed
- repeated
- repetitive
- replaced
- replicates
- Reporting
- represented
- required
- research
- resonance
- responses
- reverse
- right
- RNA
- Room
- routinely
- s
- same
- scales
- scan
- scattered
- SCI
- scientific
- score
- scores
- sections
- selected
- sequencing
- Serum
- set
- Sets
- settings
- Short
- Sides
- signals
- Signatures
- significant
- significantly
- similar
- single
- Slides
- Slope
- Software
- solution
- Solving
- some
- Sony
- Source
- Spark
- specific
- specified
- Spectral
- Spectroscopy
- split
- Stacks
- standard
- start
- statistical
- steel
- Step
- stored
- Study
- Subsequently
- summed
- supplement
- support
- Supporting
- Surface
- Surgery
- suspension
- system
- Systems
- T
- table
- Technical
- Technologies
- ten
- tested
- Testing
- texas
- that
- The
- their
- Them
- then
- theory
- therefore
- These
- they
- this
- three
- Through
- time
- times
- tissue
- to
- tool
- top
- Total
- transfer
- transferred
- Transformation
- treated
- treatment
- true
- tunnel
- Twice
- two
- Uk
- Ultrasonic
- under
- underwent
- unique
- unit
- university
- until
- uptake
- USA
- use
- used
- using
- value
- Values
- variables
- Versus
- viability
- Voltage
- volume
- W
- was
- washing
- Water
- we
- week
- weight
- WELL
- were
- when
- which
- while
- white
- WHO
- Wire
- wireless
- with
- within
- Work
- working
- zephyrnet
- Zeta
- zombie