SNEAK PEEK:
- According to recent research, the KDA market is under the “bear rule.”
- Indicators suggest that bear strength is escalating.
- Will the bulls recover and break the bear’s grip?
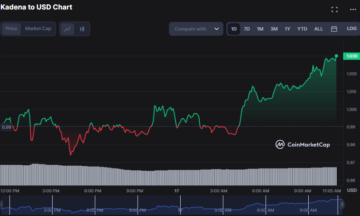
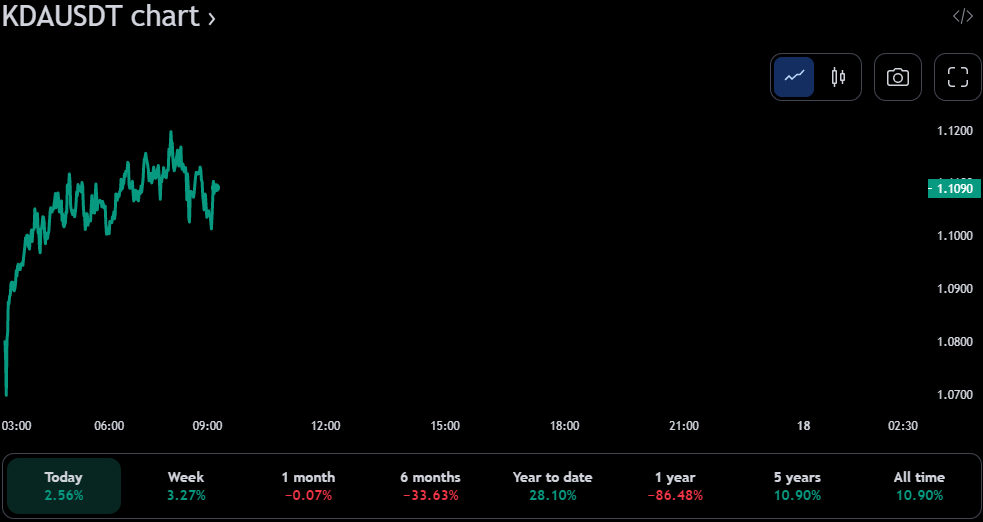
Although opening with positive momentum, the bears eventually took control of the Kadena (KDA) market. KDA dropped to an intraday low of $1.08 due to a retreat from the day’s high of $1.18 when buyers encountered significant resistance. The bearish grip has pushed the price down to $1.10, a drop of 5.16% as of press time.
Both market capitalization and 24-hour trading volume fell by 5.09% to $242,926,159 and 1.48% to $14,506,752, respectively, as traders fled the market out of concern over a prolonged bear run. Even still, the market seems to be emerging from its bearish slump, with bulls making a last effort to regain the KDA market.
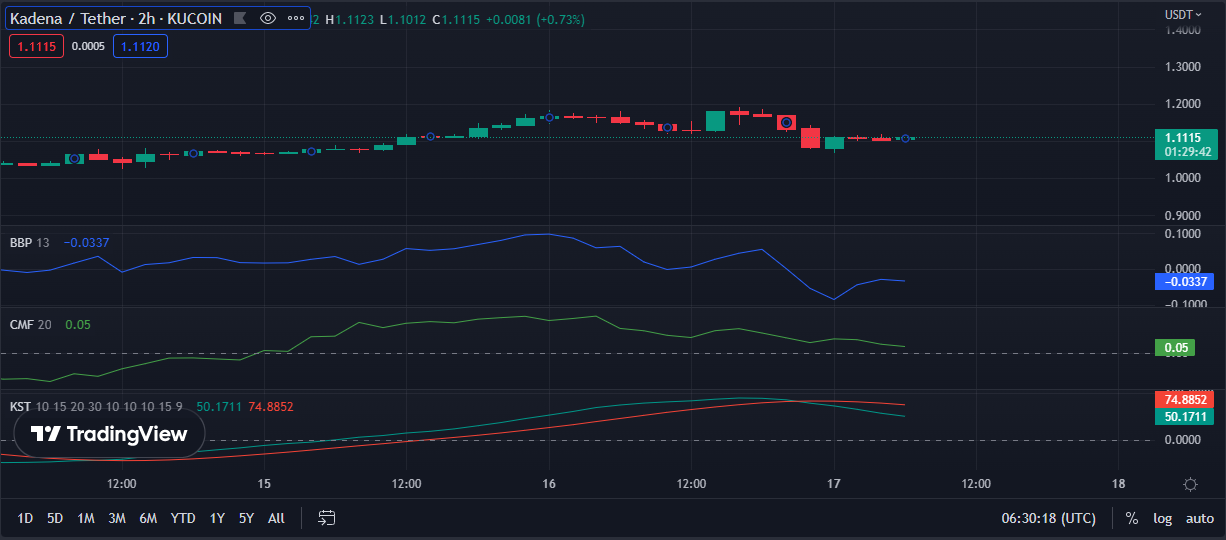
The bearish momentum in KDA is visible as the Bull Bear Power (BBP) trends south and into the negative zone with a value of -0.0335 as investors grow more pessimistic and markets fall into a bearish cycle. Given this, investors must be prudent while investing in the present market conditions.
The Chaikin Money Flow (CMF) value of 0.04 suggests that, despite the negative BBP readings, investors have not entirely exited the markets, meaning there is still some purchasing activity. Therefore, notwithstanding the negative trends in the KDA, investors should not be discouraged from investing since the CMF suggests that money is still pouring into the market and that there is still room for profit.
Additionally, the Know Sure Thing (KST) is trending below its signal line, reflecting an opposing view, with a value of 49.9063. This change in mood suggests that investors should be cautious and watch their investments to adjust positions as necessary.
Further signaling that the negative hold in KDA will prolong, the BBP line on the 24-hour price chart goes below the “0” line with a value of -0.0604 and heads south, indicating a long-term slump in the market. Also, the CMF indicator tends to be negative, with an index value of -0.14, showing significant selling pressure from market participants and poor purchasing activity, implying that the bearish trend for KDA may continue in future trading sessions.
Also supporting the assumption that the bearish trend will continue in the near future is the fact that the KST is still trending below its signal line and in the negative zone with a reading of -0.8534. Consequently, the negative attitude in the KDA will likely persist as long as the bearish indicators are strong.

Technical indicators warn traders the negative hold in KDA may extend as bear strength grows.
Disclaimer: In good faith, we disclose our thoughts and opinions in our price analysis, as well as all the facts we give. Each reader is responsible for his or her own investigation. Reader discretion is advised before taking any action.
- SEO Powered Content & PR Distribution. Get Amplified Today.
- Platoblockchain. Web3 Metaverse Intelligence. Knowledge Amplified. Access Here.
- Source: https://investorbites.com/kadena-kda-price-analysis-17-2/
- 1
- 10
- a
- Action
- activity
- All
- analysis
- and
- assumption
- attitude
- Bear
- bearish
- Bearish Momentum
- Bears
- before
- below
- Break
- bull
- Bulls
- buyers
- capitalization
- cautious
- Chance
- change
- Chart
- Concern
- conditions
- Consequently
- continue
- control
- cycle
- Despite
- Dip
- Disclose
- discouraged
- discretion
- down
- Drop
- dropped
- each
- effort
- emerging
- entirely
- Even
- eventually
- extend
- Fall
- flow
- from
- future
- Give
- given
- Goes
- good
- Grow
- Grows
- heads
- High
- hold
- HTTPS
- important
- in
- index
- Indicator
- Indicators
- internal
- investigation
- investing
- Investments
- Investors
- Kadena
- KDA
- Know
- Last
- likely
- Line
- Long
- long-term
- Low
- Making
- Market
- Market Capitalization
- market conditions
- Market News
- Markets
- meaning
- Momentum
- money
- mood
- more
- Near
- necessary
- negative
- news
- opening
- Opinions
- own
- participants
- pessimistic
- plato
- Plato Data Intelligence
- PlatoData
- poor
- positions
- positive
- power
- present
- press
- pressure
- price
- Price Analysis
- price chart
- Profit
- purchasing
- pushed
- Reader
- Reading
- recent
- Recover
- research
- Resistance
- responsible
- Revealed
- Room
- Rule
- Run
- seems
- Seize
- Selling
- sessions
- should
- Signal
- significant
- since
- Slump
- some
- Source
- South
- stablecoin
- Still
- strength
- strong
- Suggests
- Supporting
- taking
- The
- their
- therefore
- thing
- time
- to
- Traders
- Trading
- Trading sessions
- trading volume
- TradingView
- Trend
- trending
- Trends
- under
- value
- View
- visible
- volume
- Watch
- What
- What is
- while
- will
- Yield
- zephyrnet